

Covariance and correlation
Measuring pairwise associations
Choose analysis.statistics.correlation. Enter voltage;response;influence, explicitly set pairwise in Missing-pair policy and use guide.correlation.baseline in Pairwise results Dataset ID. Start with the plots disabled and press Run selected method.
The provider’s initial output ID is statistics.correlation.pairs. The exercise uses a dedicated name.
Configuration in the GUI
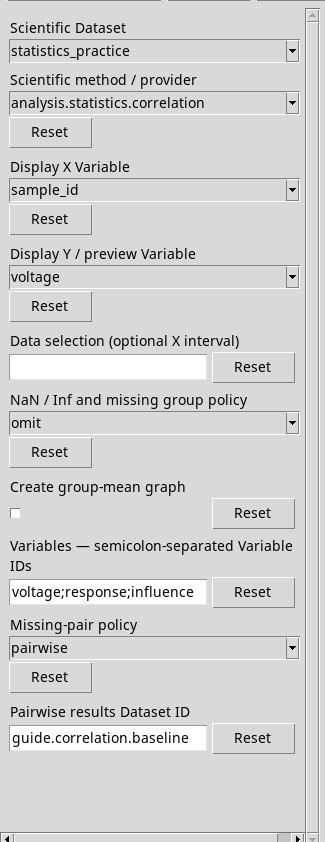
List, missing data and heatmap
- Variables — semicolon-separated Variable IDs
- Enter at least two numeric columns. The result rows cover the ordered pairs, self-pairs included. Three columns produce nine rows.
- Missing-pair policy
pairwise(initial) uses all the rows that are finite in both columns of the pair, so n may vary.listwiseuses the same set of rows finite in every column for all pairs. To see the difference, addincomplete. With NaN / Inf and missing group policy set toerrorthe presence of a non-finite measurement blocks the processing. If the menu showslistwise_omitoerroras the pair policy, select one of the two options allowed by the method instead.- Create group-mean graph
- Enable it to request the Pearson heatmap. As with the other methods the displayed name is shared. Numeric publishing remains available with the box unticked.
Interpreting covariance, Pearson and Spearman
Read the report of Covariance and Correlation and the pair table. The covariance of voltage e response is about 27.412 V² with the sample divisor. The observed population covariance is 25.889 V². Pearson measures linear association and Spearman monotonic association on ranks. Both are dimensionless and range from −1 to +1 when defined.
For voltage e influence, Pearson is about 0.499 and Spearman 0.984. The extreme point mainly changes the linear association. Check the per-pair counts and the undefined conditions if you enter constant or if fewer than two valid rows remain. The association may reflect common variables or the study design. Stability across methods and data must be assessed with plots and knowledge of the sampling.
Result in the GUI
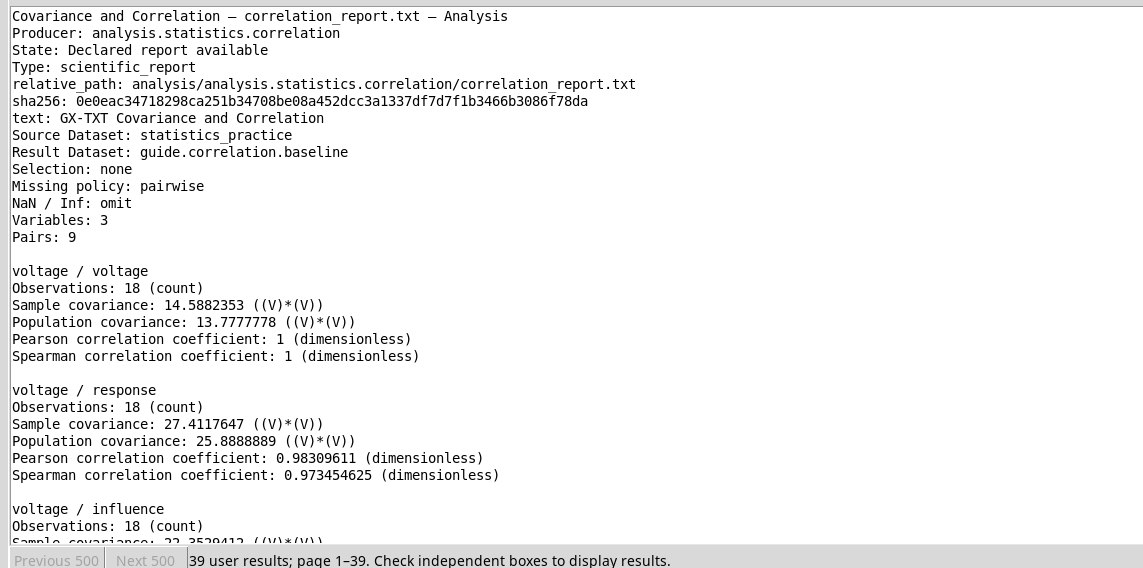
Plot in Plots

For output IDs, selection and publishing criteria see Options shared by the providers. To look up or open the result go to Tables, reports and plots.