

Weighted statistics
Assigning weights to observations
Choose analysis.statistics.weighted. Set Numeric measurement a voltage e Statistical weight or measurement uncertainty a weight. Leave Weight semantics at statistical_weight e Mean uncertainty model at none. Use guide.weighted.baseline as the prefix and run.
The provider’s initial output prefix is statistics.weighted. The exercise uses a dedicated name.
Configuration in the GUI
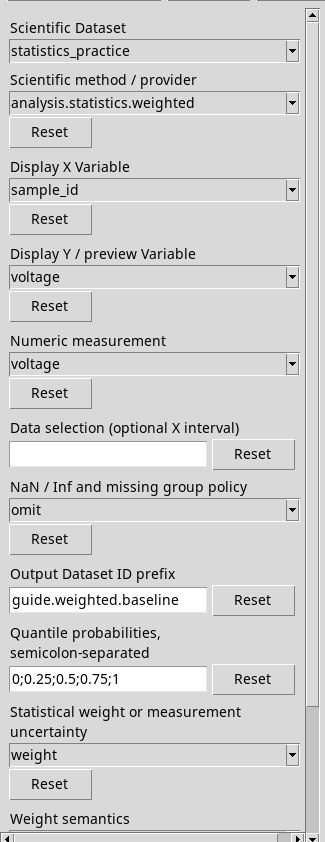
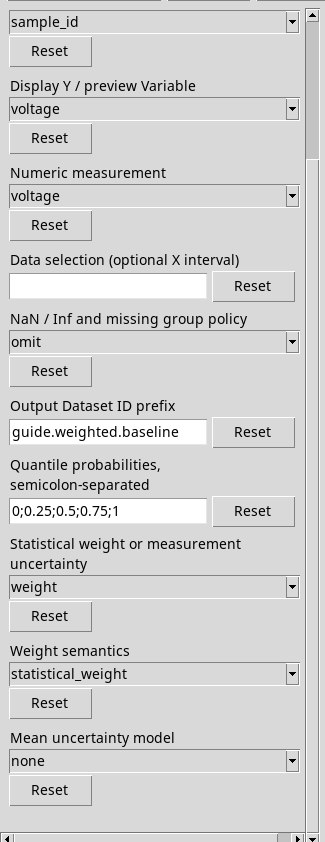
Choosing weights and uncertainty
- Statistical weight or measurement uncertainty
- Select the second column of the pair, row by row. The meaning of its numbers depends on the weight model.
- Weight semantics
statistical_weight(initial) accepts non-negative dimensionless weights. Rows with zero weight appear in the valid count and contribute nothing.inverse_variance_uncertaintyrequires positive standard uncertainties in units compatible with the measurement. Selectu_voltage. The uncertainties are converted into the unit of the measurement and transformed into weights 1/u².- Mean uncertainty model
noneleaves the sample standard error unrequested. Withsamplingthe report attempts the estimate √(corrected weighted variance / neff), if the sample is sufficient. Where applicable, the formula √(1/Σw) describes the uncertainty of the mean from known and independent measurement uncertainties. The two fields answer to distinct models, even though both are expressed in V.- Quantile probabilities, semicolon-separated
- Use probabilities in [0, 1], initially
0;0.25;0.5;0.75;1. The quantiles come from the inverse of the weighted ECDF. The weighted median is the point at which the cumulative mass reaches half of the total.
Mean, dispersion and effective sample size
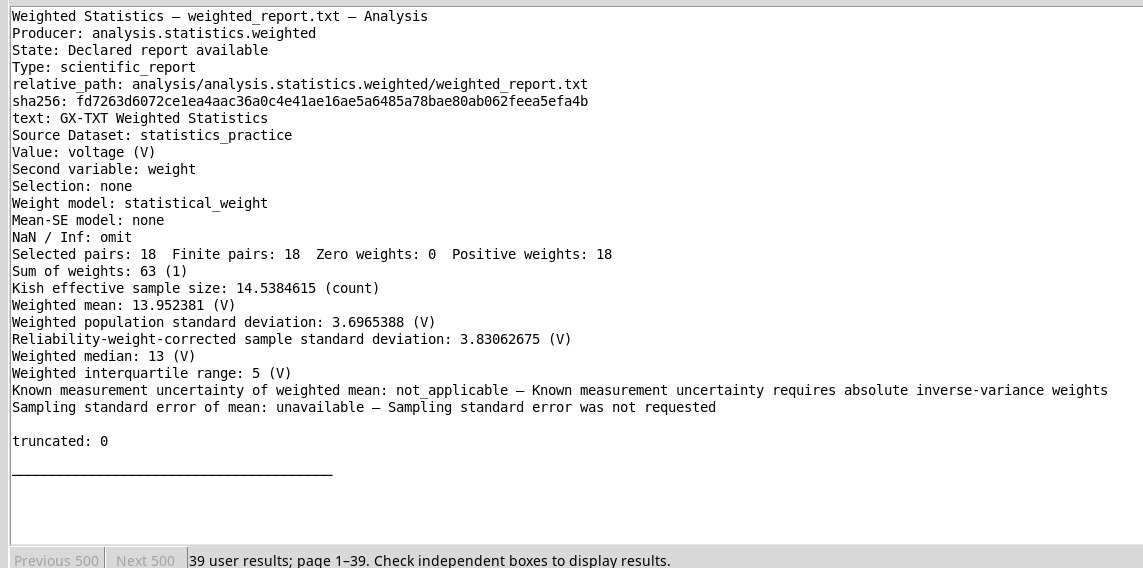
In the report weighted_report.txt there are 18 positive pairs, sum of weights 63 and weighted mean 13.952 V. neff (Kish) is about 14.538 and equals (Σw)²/Σw². It indicates how much concentration the weights introduce. Read .summary for counts, mean, variances, standard deviations, median, IQR and any uncertainties with their status. Read .quantiles for probability, value and unit.
The sampling model requires independent observations and finite variance. The measurement model requires absolute and independent standard uncertainties. Compare the two uncertainty columns with the chosen setting and read the reason for unavailability, if any.
Result in the GUI
For output IDs, selection and publishing criteria see Options shared by the providers. To look up or open the result go to Tables, reports and plots.