

GX-TXT Debugger · Module 03 — Control flow and the call stack
The GX-TXT debugger · 10-module course
When the debugger stops on a call, the next action depends on the question: is it interested to see the result in the caller or follow the calculation in the function? We compare the three advance commands, then we use the stack to read the status in separate cycles, conditions and projects.
Download the Python and GNU Octave examples (ZIP). Extract all the archive folders and keep the multifile examples files together.
D13 — Step Over in a sequence
Step Over performs current education and, in the ordinary case of a function call, returns to the next row of the caller without stopping within the called function.
Prepare the example
Import nested.py to Python Scripts, save in the session broom and set a breakpoint to adjusted = adjust(sample). The example distributed with GX-TXT sums the values 1, 2, 3, 4 and 5: the expected result is NESTED_RESULT 15. The nested.m correspondent uses the same calculation in Octave.
Start View → Debugger → Start Debug. If the initial breakpoint is before the breakpoint, press Continue to reach it. In the first iteration sample is 0 and total is 0. Press Step Over on the adjust(sample) call.
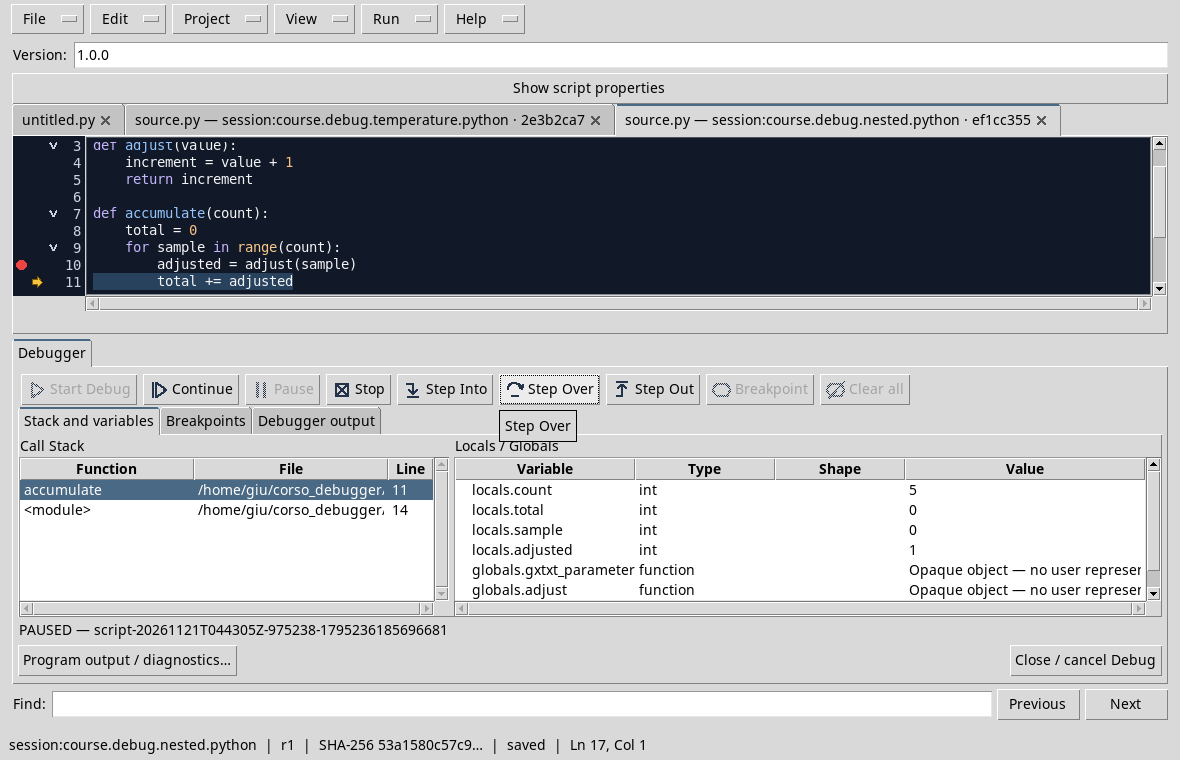
The arrow moves to the total += adjusted line. The panel shows adjusted = 1, while total = 0: the update of the total has yet to be executed. An additional Step Over performs the sum. The red point on the call remains and can stop the subsequent iterations again.
Exercise
To the first iteration which will be total after performing total += adjusted?
Worked solution
Vale 1: the previous total is 0 and adjusted worth 1. The line highlighted in the screenshot has not yet been executed.
Course index · Previous lesson
D14 — Step Into a function
Step Into allows you to follow a call inside a language function. It is the useful command when the hypothesis concerns the internal calculation, rather than its only result.
Enter to adjust
Use nested.py recorded at Session. Set a breakpoint on the adjusted = adjust(sample) line and start the debug. On the call break, press Step Into. If you leave from the first break of the program, use Continue to reach the breakpoint.
In the illustrated test we find ourselves at the second iteration: sample is 1. The debugger enters the adjust function, shows the increment = value + 1 line and the local value = 1 variable.
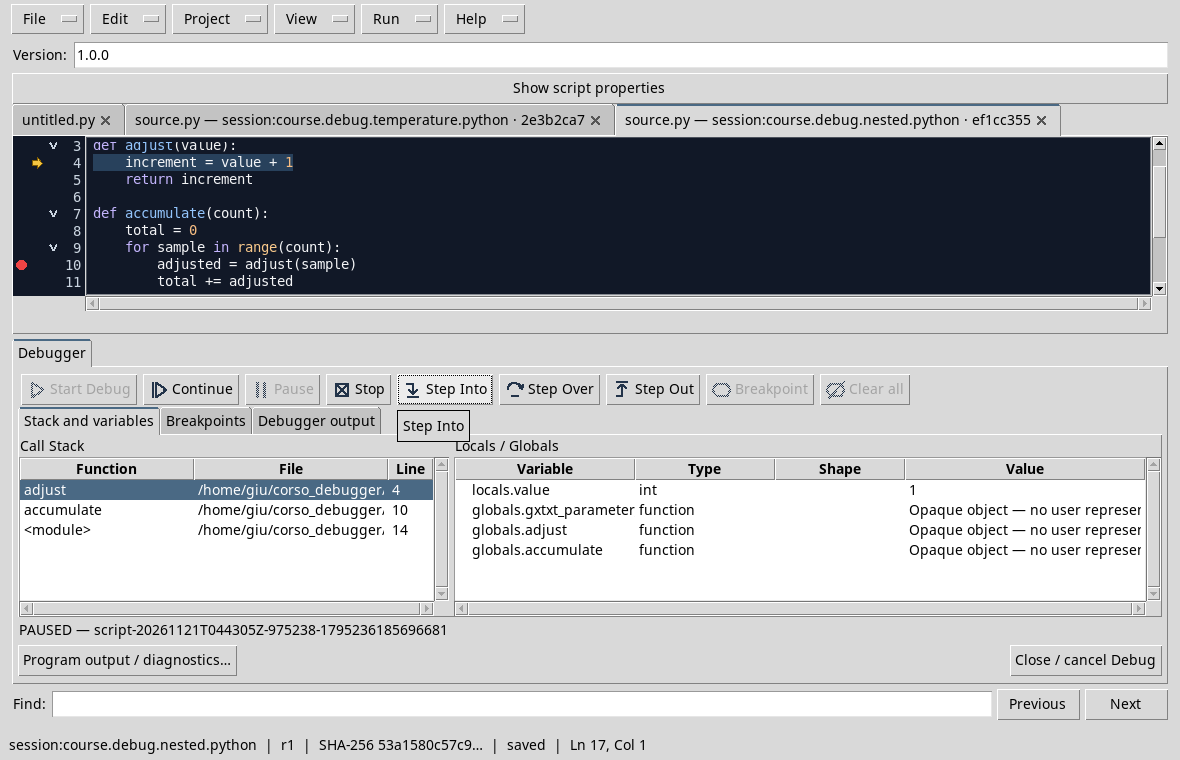
The Call Stack panel shows adjust, accumulate and the script level. value is the local topic of the function called; sample instead belongs to the caller. At the first iteration the corresponding values are 0, because range(5) begins with 0.
Exercise
If sample is worth 1, what value will adjust return after performing increment = value + 1?
Worked solution
It will remain 2. Before the assignment, the debugger is on the calculation line and value is 1.
Course index · Previous lesson
D15 — Step Out and return to the caller
After inspecting a function, Step Out continues its execution until returning to the caller. In this way you do not need to manually follow each instruction left in the function.
Exit to adjust
Open nested.py, put a breakpoint on the adjust(sample) call and use Step Into as in the D14. When you’re stationed in adjust, press Step Out.
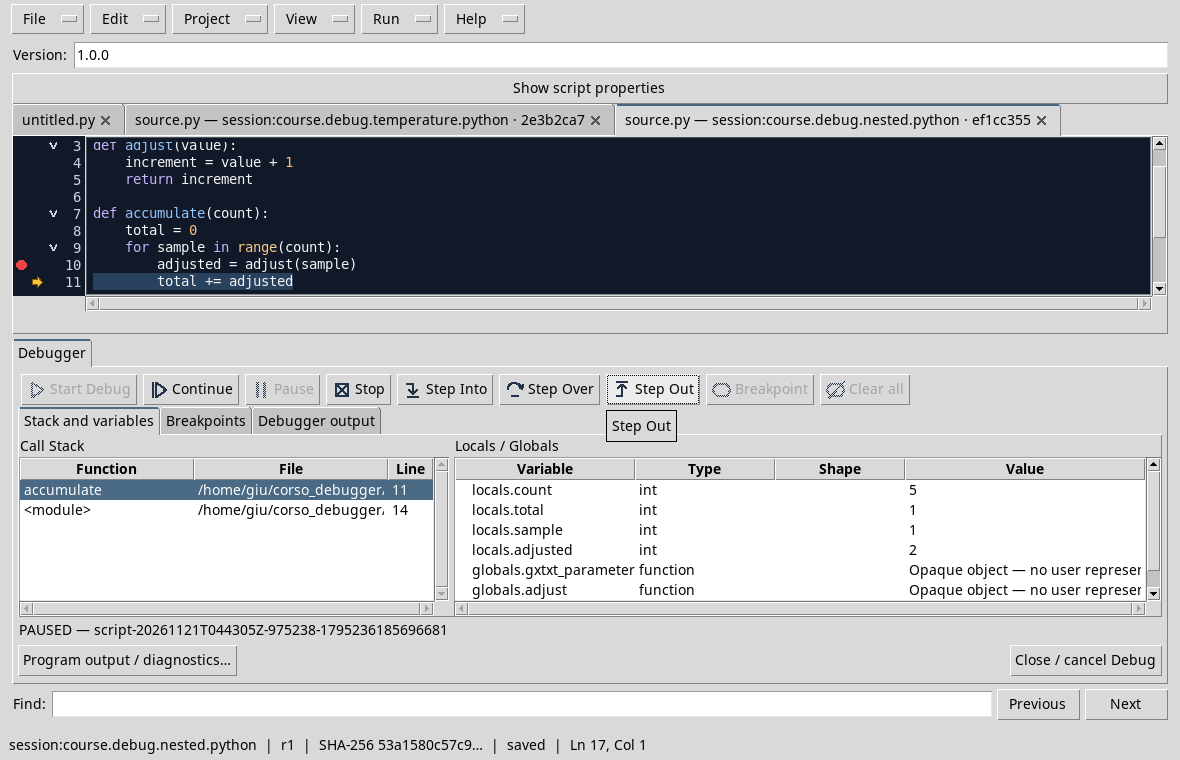
In the test, at the second iteration, the debugger returns to accumulate on the total += adjusted line. The panel shows sample = 1, adjusted = 2 and total = 1: the returned value has been assigned, but the upgrade of total is still to be executed. In the first iteration adjusted would be 1 and the previous total 0.
Any breakpoint encountered in the path can affect the next break: always check arrow, stack and state, instead of assuming the point reached.
Exercise
After the screenshot, how much will the total pass when the highlighted line will be executed?
Worked solution
3: the previous total is 1 and the value returned from the second call is 2.
Course index · Previous lesson
D16 — The Call Stack and the selected frame
The call stack describes how the execution came to the pause point. Each row represents a frame, with the function, file and location associated.
Compare function and caller
With nested.py, stop at adjust using the breakpoint on the call and Step Into, as in the D14. The stack contains adjust, its caller accumulate and the script level.
Select accumulate in the Call Stack panel to examine the caller. In the frame of the called function you find value; in the caller you can compare sample, total and other local variables present at that time.
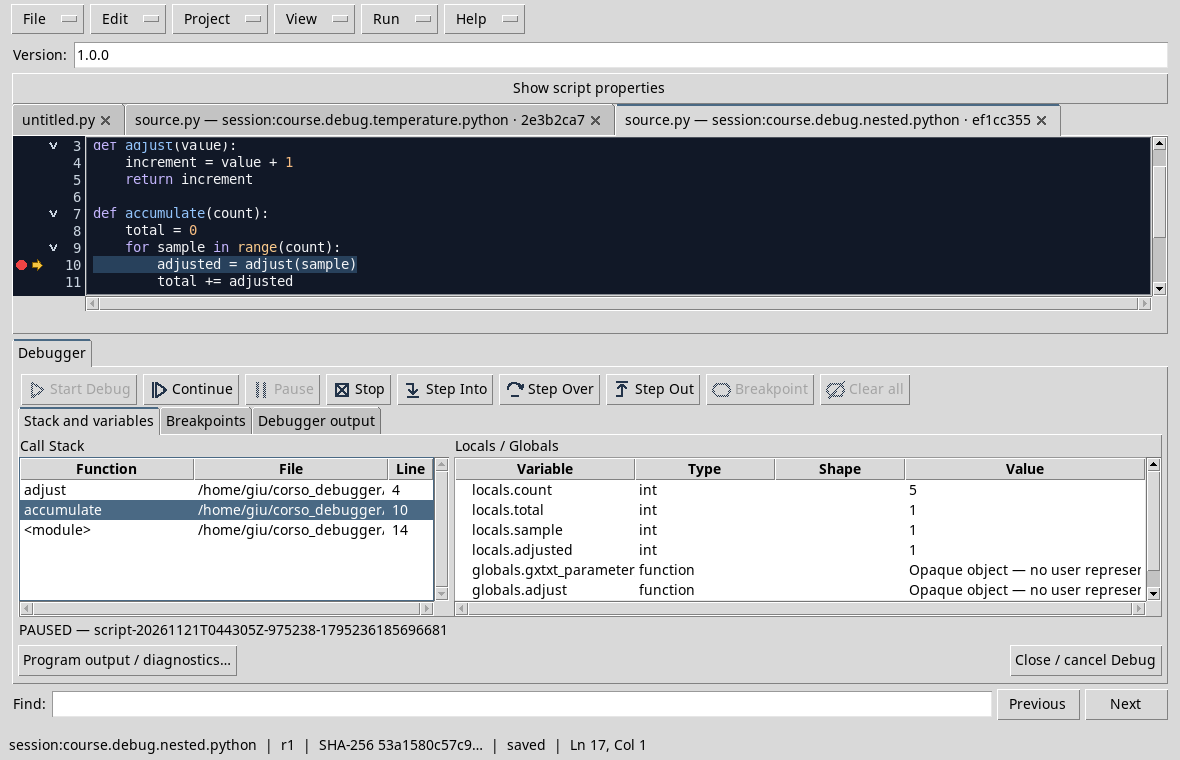
Selecting a stack row does not run the program and does not move its true execution point. Change the context you are looking at; to resume with the execution commands, check the active frame and the arrow shown. An external frame can refer to another file: always read the path and the line number.
Exercise
If you select the caller while adjust is on break, is the adjust function already back?
Worked solution
No. The selection is used to observe another frame. To continue the function you need an execution command, for example Step Out.
Course index · Previous lesson
D17 — Loops and conditions
A breakpoint inside a cycle can stop the execution several times on the same line. To understand which iteration we are observing, we must read the values of variables, not only the line number.
A simple filter
Import and record filter_sum.py in Python Scripts. Synthetic data are 1, 2, 3 and 4; the script sums only the greater values of 2. The expected result is FILTERED_TOTAL 7.
Set a breakpoint on the if sample > threshold: line and start Start Debug. If the execution stops first, press Continue to reach the point. At the first iteration sample is 1 and threshold is 2: the condition is false and the body of the if is not executed.
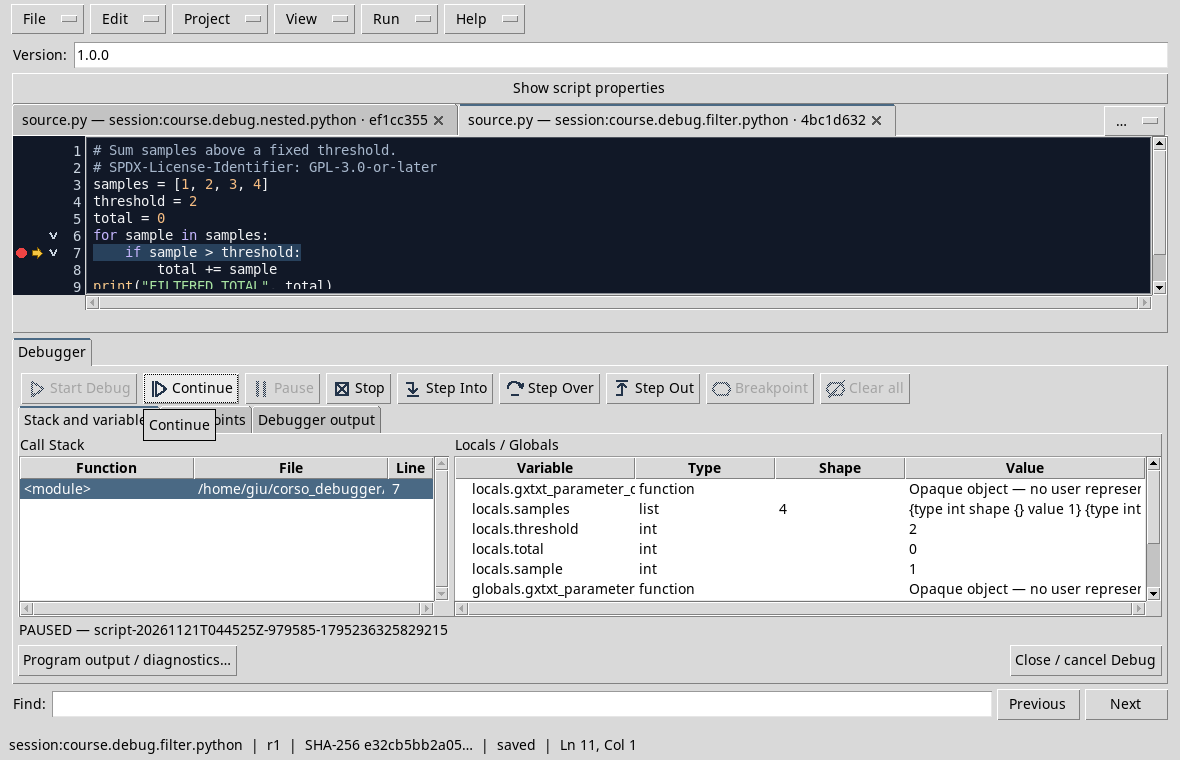
Press Continue to reach the same line in subsequent iterations. The third sample is worth 3: Press Step Over on the condition. The next line is total += sample, because 3 is greater than 2:
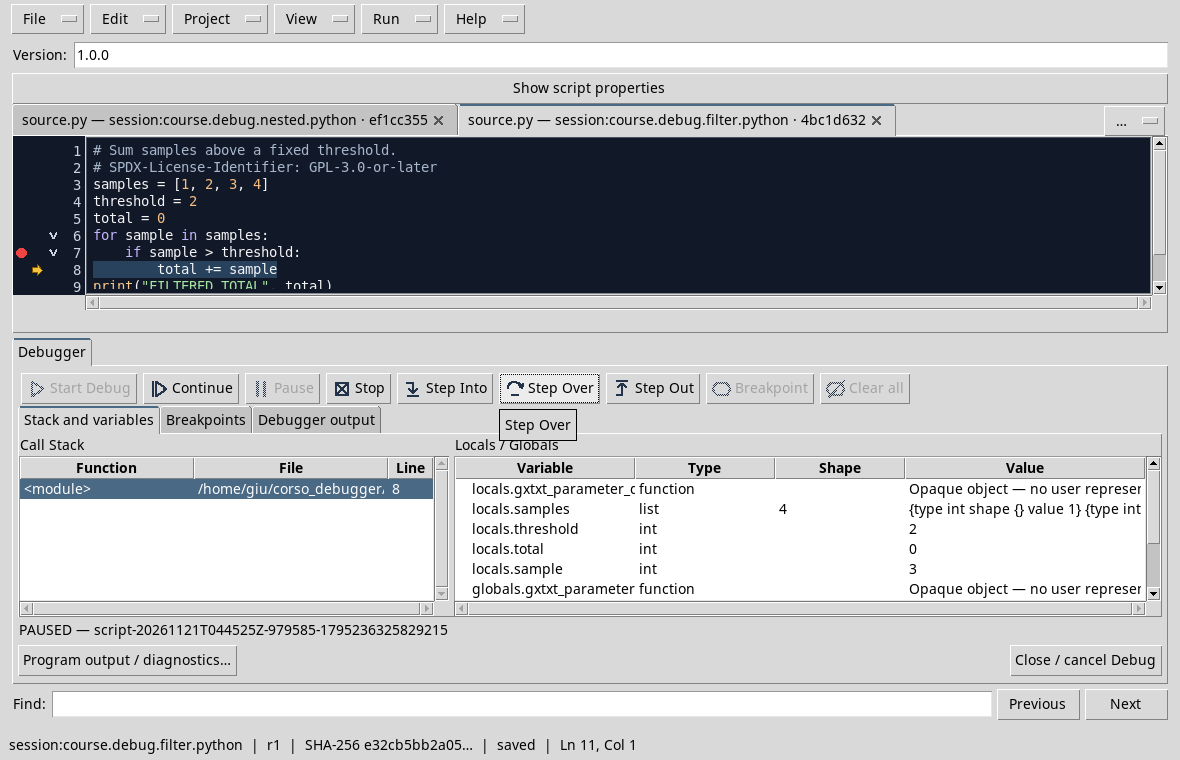
The highlighted line has not yet updated total, which in the screenshot is worth 0. Continuing, the 4 value also exceeds the threshold. At the end the total is 7. An ordinary breakpoint repeats itself at every step of the line: we are not describing it as a conditional breakpoint.
Exercise
What values would enter the total if the condition was sample >= threshold? What result would you expect?
Worked solution
2, 3 and 4, for a total of 9. Edit and save a copy of the script and update the setup before verifying it.
Course index · Previous lesson
D18 — External files and stack frames
A project can separate the entry point and support functions in different files. The debugger must show the file and row of the frame actually selected: follow only the line number is not enough.
Creating the project
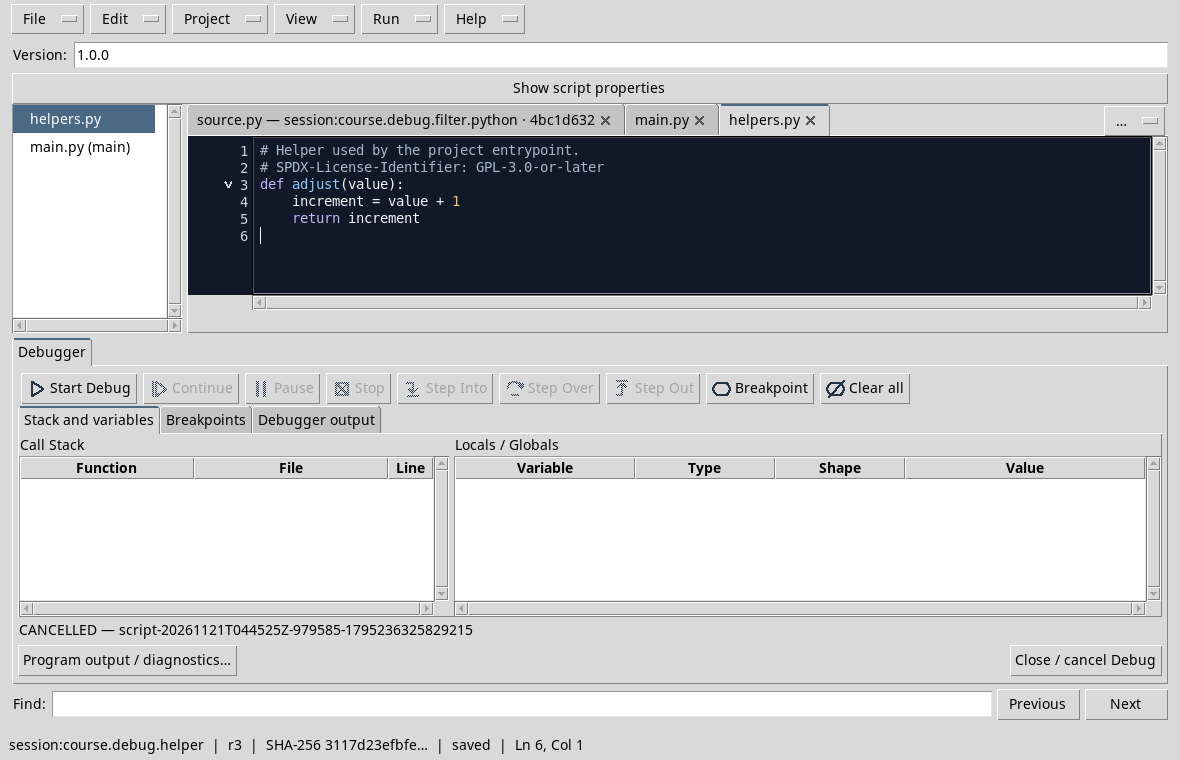
The two sample files are main.py and helpers.py. main.py calls adjust(4), defined in helpers.py; the expected result is ADJUSTED 5.
In Python Scripts choose Project → New Project, assign name and ID, use the session broom and retain main.py as entrypoint. Insert the attached file into the main file. With Project → New file creates helpers.py and enter the content of the function. Use File → Save All to save the entire project.
Follow the call between the files
Open helpers.py from the project shaft and put a breakpoint on the increment = value + 1 line. Open the debugger and start Start Debug. If the program initially stops in the main file, press Continue to reach the breakpoint in the support file.
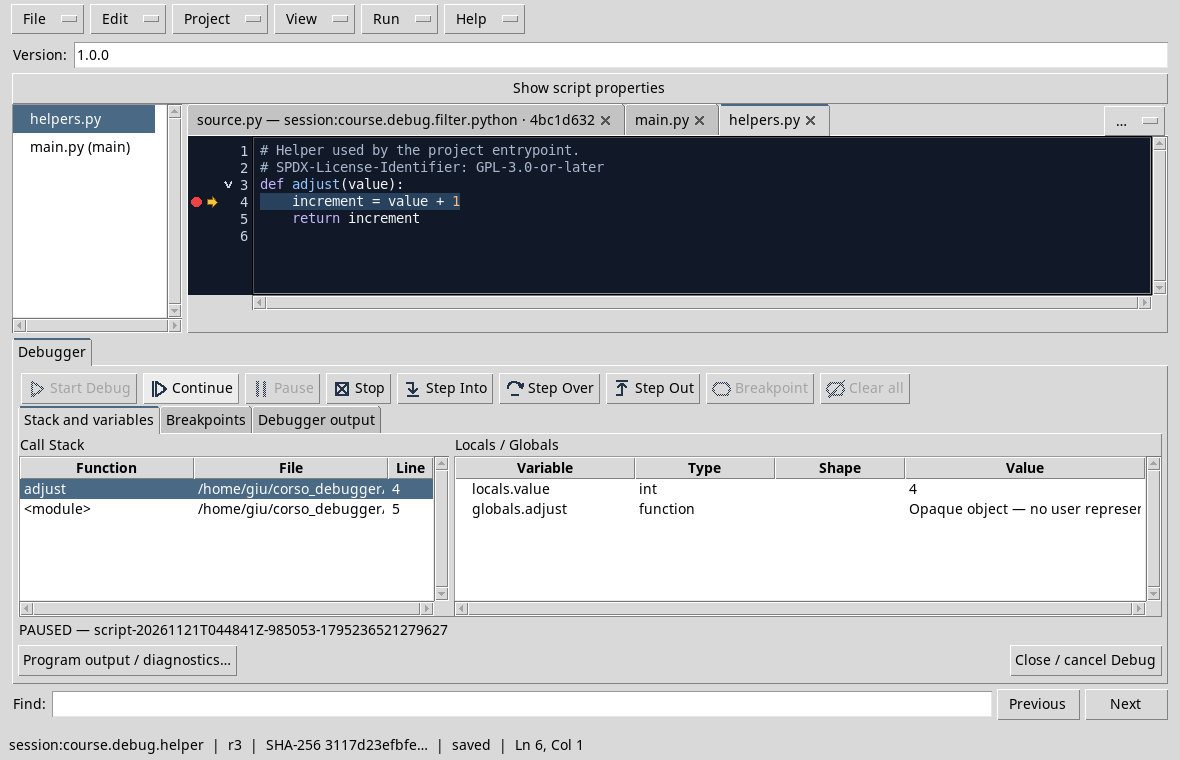
In the GX-TXT test shows the helpers.py card, the 4 and value = 4 line; in the stack the caller also appears in the main file. Selecting the frames you can compare the respective paths and rows. A library function outside the project can have a different path: use the one shown by the debugger and do not attribute its line to the currently visible file.
Press Continue to finish: the program must produce ADJUSTED 5. A subsequent modification of a file requires you to save the project and start a new trial with breakpoints consistent with the revision.
Exercise
If the frame adjust indicates the line 4 of the helpers.py and the caller the line 5 of the main.py, do they refer to the same source location?
Worked solution
No. They are rows of two different files: the first contains the function called, the second call. The stack connects the two positions.
Course index · Previous lesson
Advancement leads to the right point. The next module shows how to read the frame status and separate it from the output and program errors.
Previous: Module 02 · 10-module course contents · Next: Module 04
Other steps of this project
- Debugging GNU Octave in GX-TXT: Breakpoints, Variables and Public APIs
- GX-TXT Debugger · Module 08 — Projects, revisions and Sessions
- GX-TXT Debugger · Module 09 — Integrated practical cases
- GX-TXT Debugger · Module 10 — Independent debugging and the final project
- GX-TXT Debugger · Guide 05 — Debugging scientific data: vectors, structures and Datasets
- GX-TXT Debugger · Guide 06 — Debugging a complete scientific workflow