

GX-TXT Debugger · Module 04 — Variables and diagnostics
The GX-TXT debugger · 10-module course
A pause screen collects information of a different nature. To interpret it, you should ask first which frame is selected, then what comes from the program and what has been recorded by the debugger. Examples of the module refer to brooms, reepylogues, output and final status of the Job.
Download the Python and GNU Octave examples (ZIP). Extract all the archive folders and keep the multifile examples files together.
D19 — Locals and Globals
A local variable belongs to the context of a function; a global is visible at the level of the program according to the rules of language. The debugger shows a summary of the values associated with the selected frame.
Watch two frames
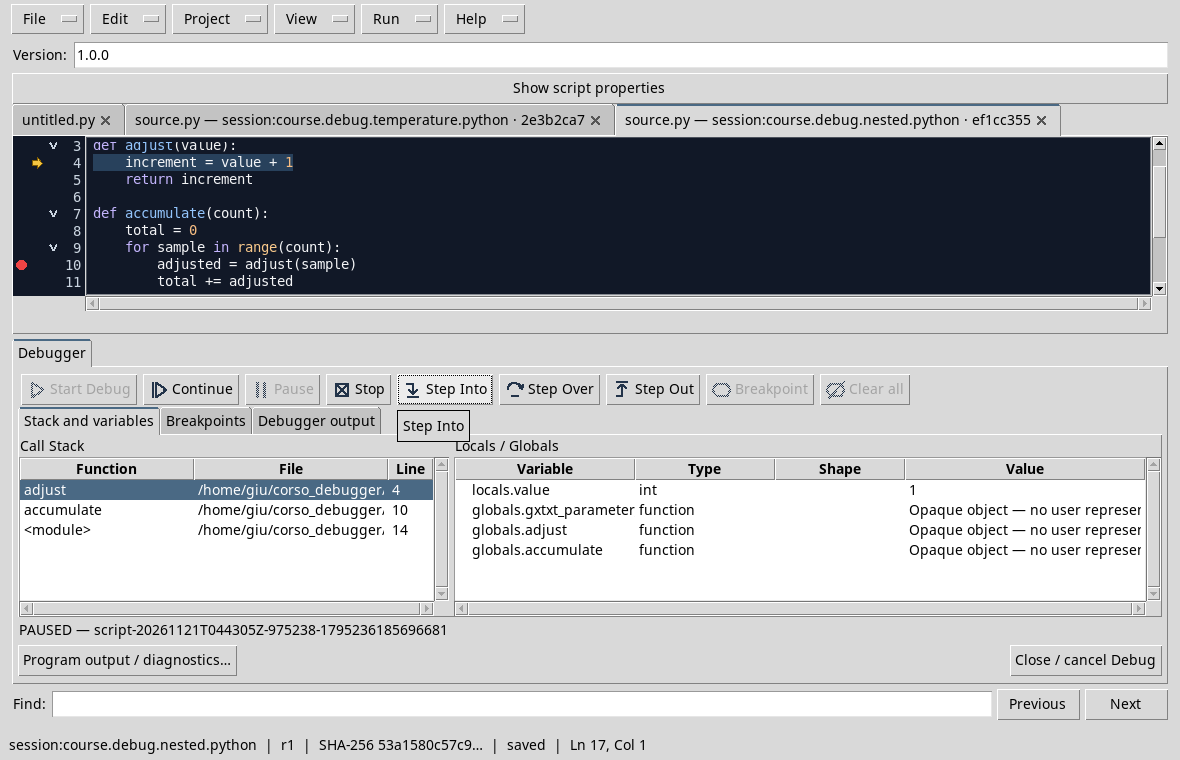
Import nested.py, set the breakpoint on the adjust(sample) call and, when it is reached, press Step Into. In the second iteration the adjust frame shows locals.value = 1:
Select accumulate in the stack: the panel changes context and shows, among others, locals.sample = 1 and locals.total = 1 in the test. If a name is preceded by globals, it refers to the global information shown by the debugger for that context.
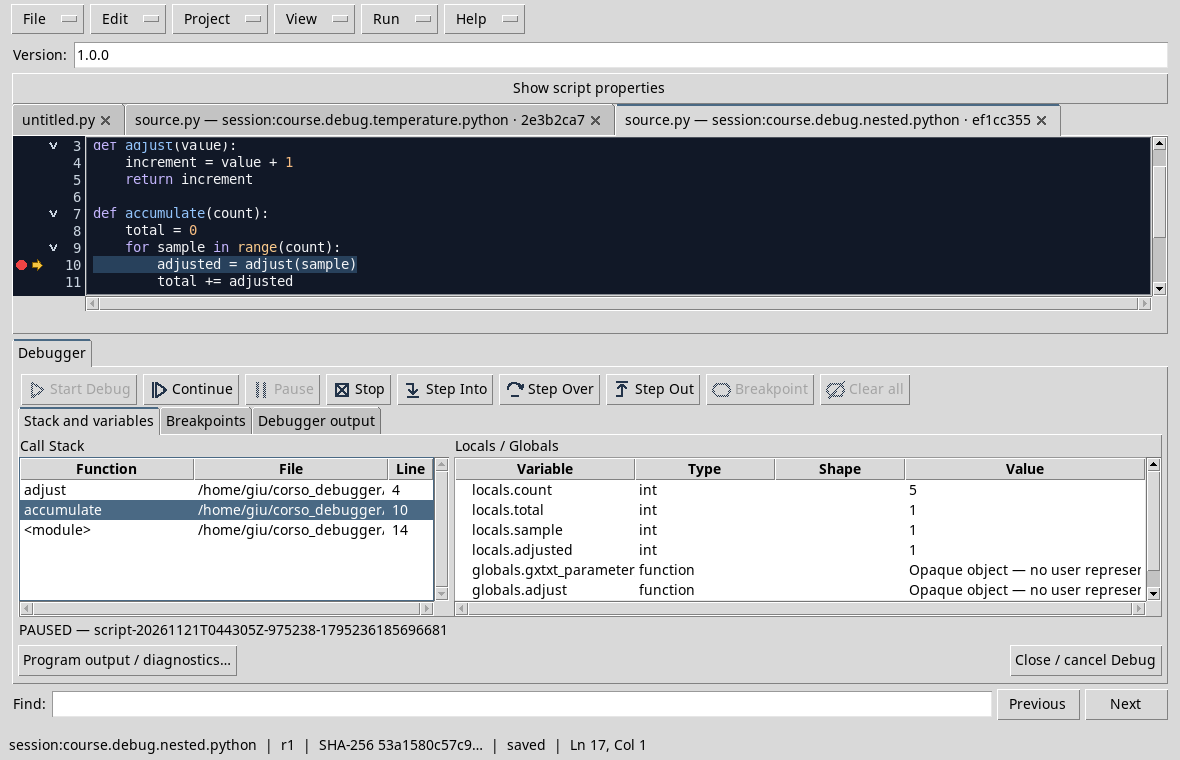
The selection of a frame is a reading operation: it does not update the total or complete the function. The content of the panel can be longer than the visible space; scroll or resize before concluding that a name is absent.
Exercise
Why do you read value in one frame and sample in the other at the same time?
Worked solution
sample is a caller variable; its value is passed as value argument to the called function. The two names belong to different contexts.
Course index · Previous lesson
D20 — Large values and display limits
The variable panel is a summary: type, shape and content shown help to orient itself, but a limited visible space does not show that all content has been displayed.
Read a list
Use filter_sum.py, stop the debugger on the condition and reach the third iteration. In the Python test the panel indicates that samples is a 4 length list, while sample, threshold and total are whole.
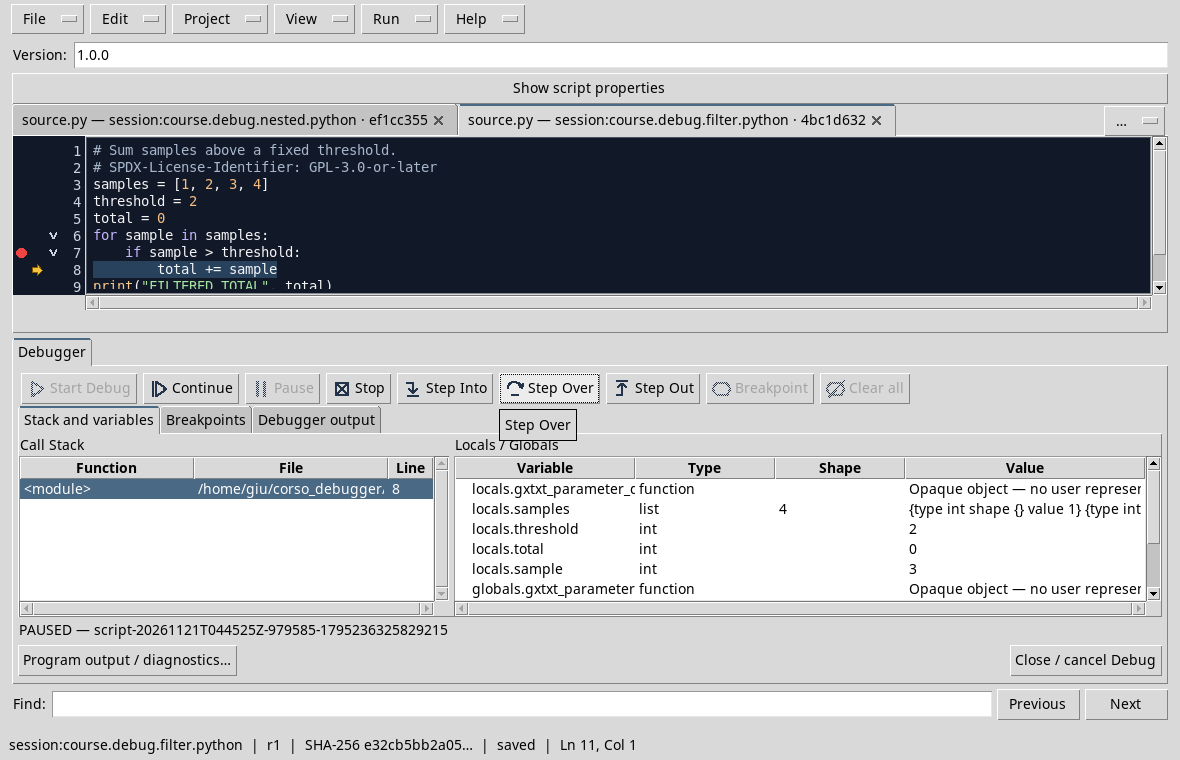
The Value column can be narrower than the text it contains. Resize the panels or scrolls when possible; if an object is larger than the available summary, a part of the values may not appear. Do not interpret a shortened display as a complete list.
For more targeted verification, prepare an intermediate variable in the script, for example first_sample = samples[0], save and debug. Alternatively, it explicitly prints what you need and consults the output of the program, distinguishing it from the debugger information. For real data avoid printing or showing confidential information.
Exercise
The list summary is cut to the right. Can you conclude that the list contains only the visible elements?
Worked solution
No. Check the declared form and use a targeted verification on the script. A reduced display space does not change the data structure.
Course index · Previous lesson
D21 — Read-only inspection and the absence of Watch
In the reference debugger, the Locals/Globals panel presents reepylogues of the selected frame values. It is not an arbitrary evaluation console and should not be presented as a Watch panel in which to insert expressions or change the values running.
Prepare a value to observe
In the Octave temperature_fixed.m script, the celsius, offset and kelvin variables are already explicit. Stop the debugger on the press: after resize the panels, the test shows 20, 273,15 and 293,15.
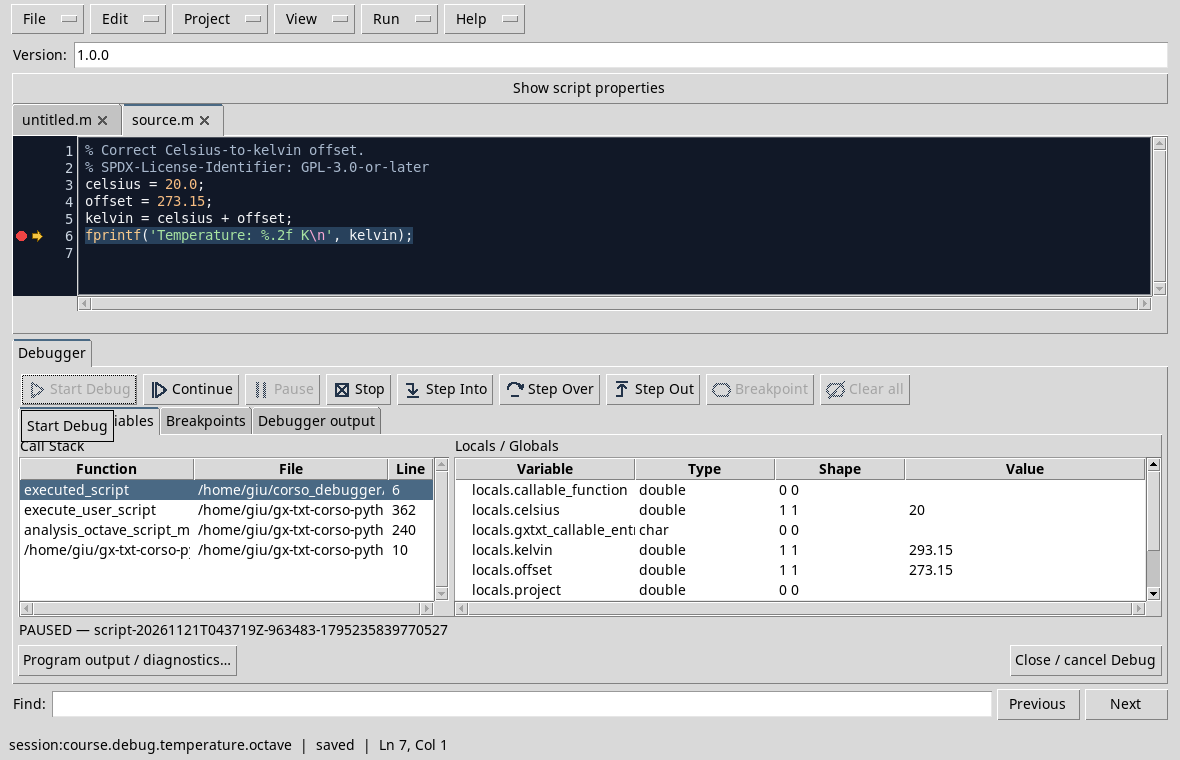
If you need to observe a more complex expression, enter a significant intermediate variable in the source, save and start a new Debug Job. For example, a copy could assign difference = kelvin - celsius; before printing. This changes the source program of the new test: it does not interactively change the Job already in pause.
Exercise
You want to see the difference between kelvin and Celsius without assuming a Watch. What procedure can you use?
Worked solution
Add an intermediate assignment to a copy of the script, save and start a new Job by stopping you after that line. For example, the expected difference is 273,15.
Course index · Previous lesson
D22 — Debugger and program output
The output Debugger tab and the output written by the script answer different questions. The first helps to follow debug states and commands; the second contains what the press program.
Two views of the same test
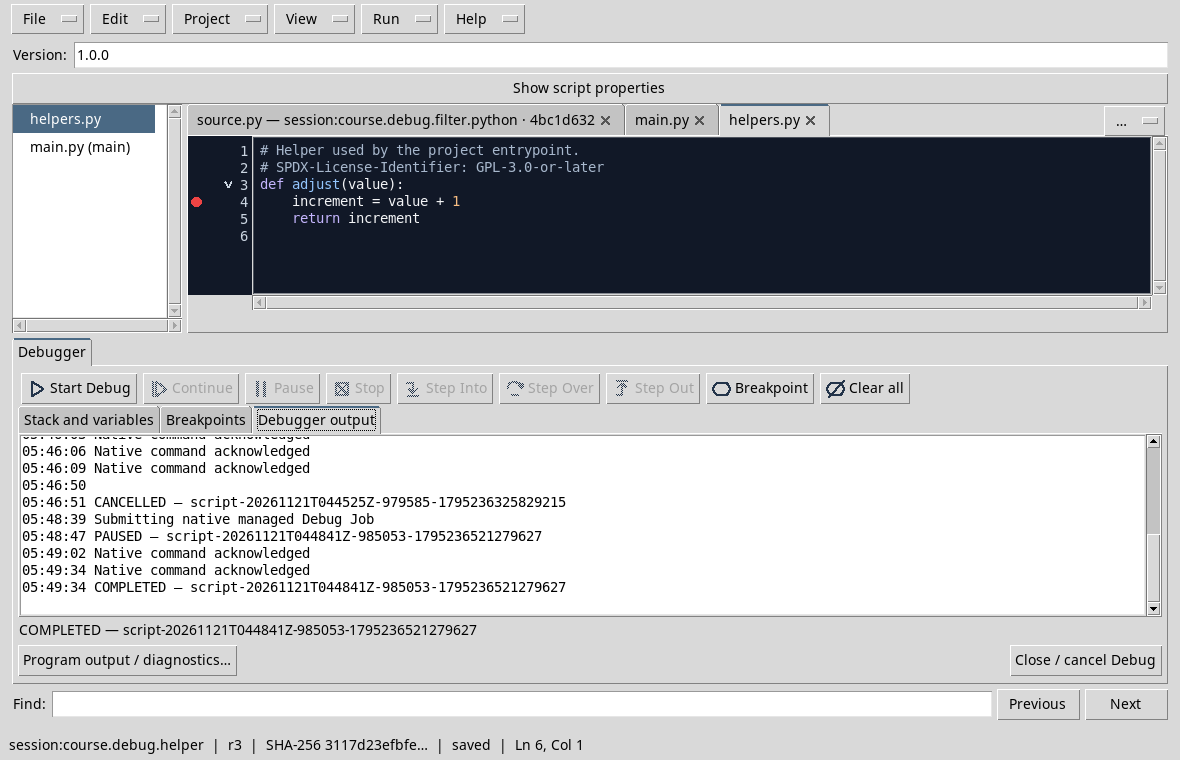
Debug the D18 multifile project, stop in the adjust function and then press Continue. Open the Debugger output tab: the test shows messages like pause, command recognition and completion.
Open instead Program output / diagnostics and select Program output. The text of the program is ADJUSTED 5:
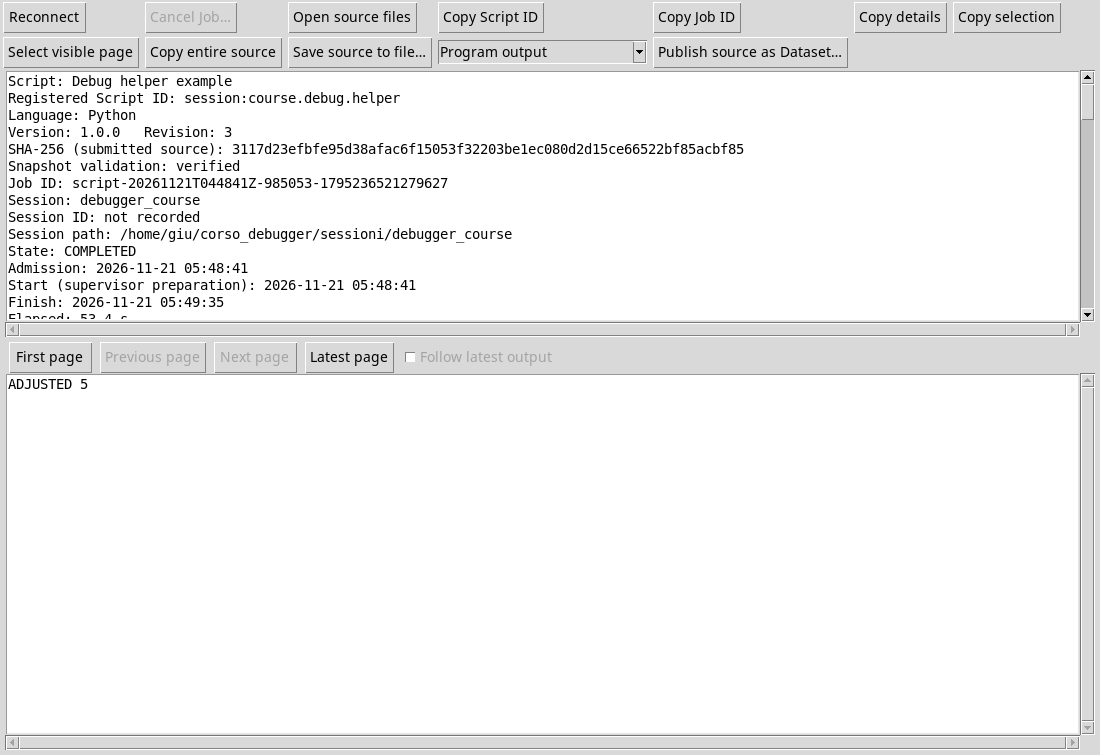
In Job details you can also check stderr and status. If you are reviewing multiple executions, check the identity of the selected Job: a previous output does not show the result of the current test.
Exercise
In what view are you looking for the print printed string? Where are you looking for a debugger break message?
Worked solution
The string of the program is in Program output; the states and receipts of the commands are in Debugger output.
Course index · Previous lesson
D23 — Errors and tracebacks
An error message is a starting point: it indicates what happened and where to search. To understand the cause, we compare the track with data and with the observed state before problematic education.
An intentionally incorrect index
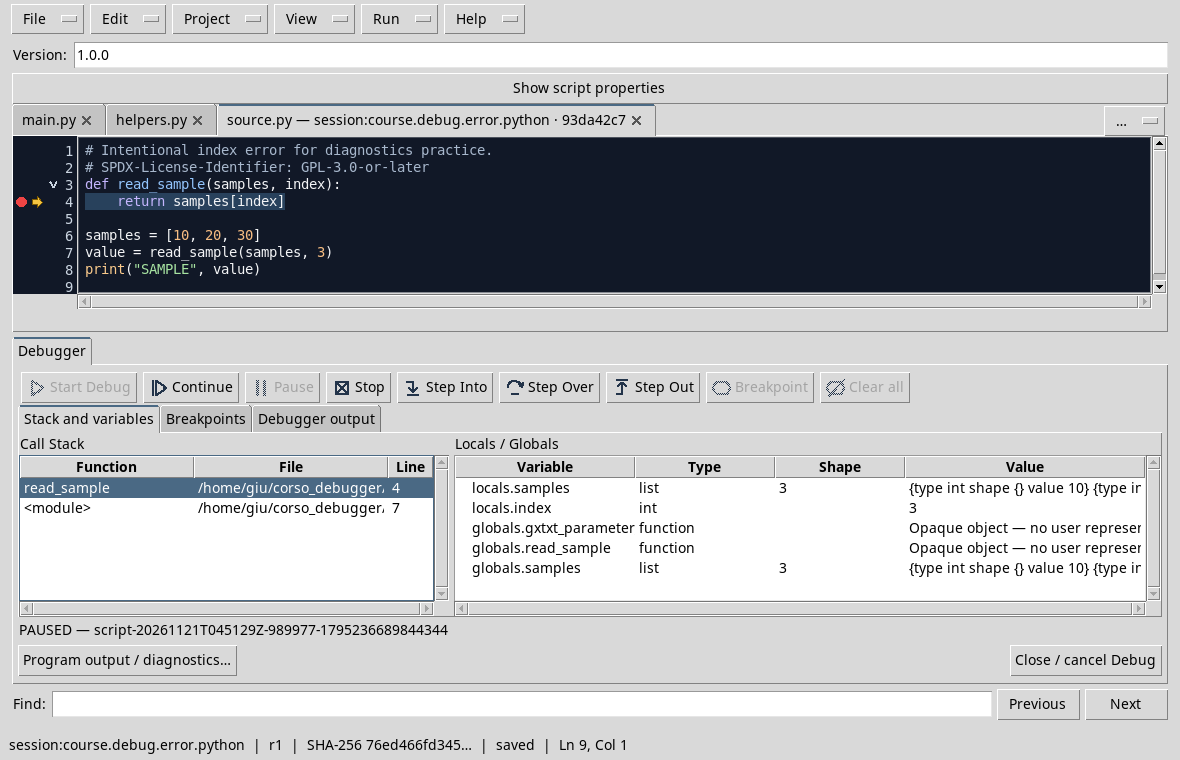
Import index_error.py to Python Scripts and save it to Session. The list contains three elements, but the program calls read_sample(samples, 3). The valid indices are 0, 1 and 2.
Put a breakpoint on return samples[index] and start the debugger. After any initial break, use Continue to get to the function. In the test the panel shows a length list 3 and index = 3:
Press Continue. The Job ends with FAILED, because access exceeds the last index. Open Program output / diagnostics and select Program stderr:
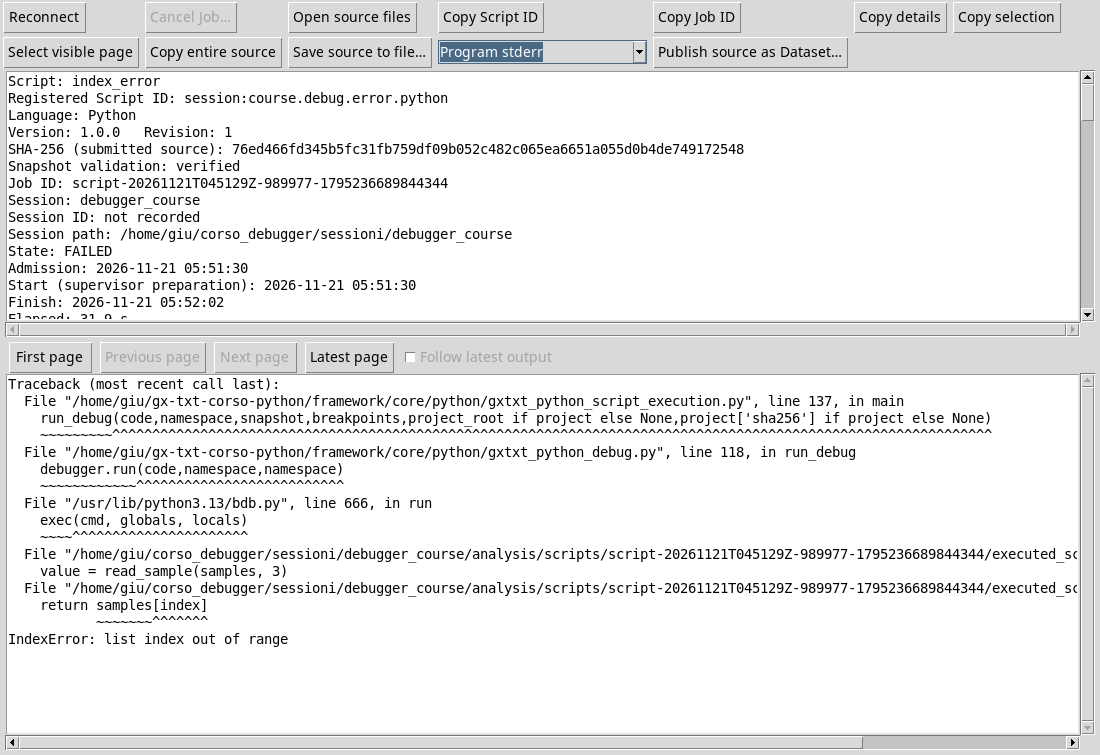
The track shows the call, access education and IndexError: list index out of range. The lines of the execution environment are part of the track; it identifies above all those that refer to your code. Once the Job is finished, the pause stack is no longer a live state.
Correct and verify
The index_fixed.py copy uses the 2 index and SAMPLE 30 printing. It is an appropriate correction if the goal was to read the last element. If the index depends on external inputs, consistent controls with the program requirements would be required.
Exercise
Why is the 3 index wrong with a long Python list 3?
Worked solution
The numbering starts from 0: the three elements have indexes 0, 1 and 2. The 3 index would require a fourth element.
Course index · Previous lesson
D24 — Job states and results
The status of a Job sums up how the trial ended. It must be interpreted together with the program, the output and the actions we have accomplished.
Three outcomes to distinguish
- COMPLETED: In the multi-file project test, the program came to the end and printed
ADJUSTED 5. - CANCELLED: In the D06 test, we pressed Stop while the program was on pause.
- FAILED: In the D23, the out-of-range index produced an unmanaged exception.
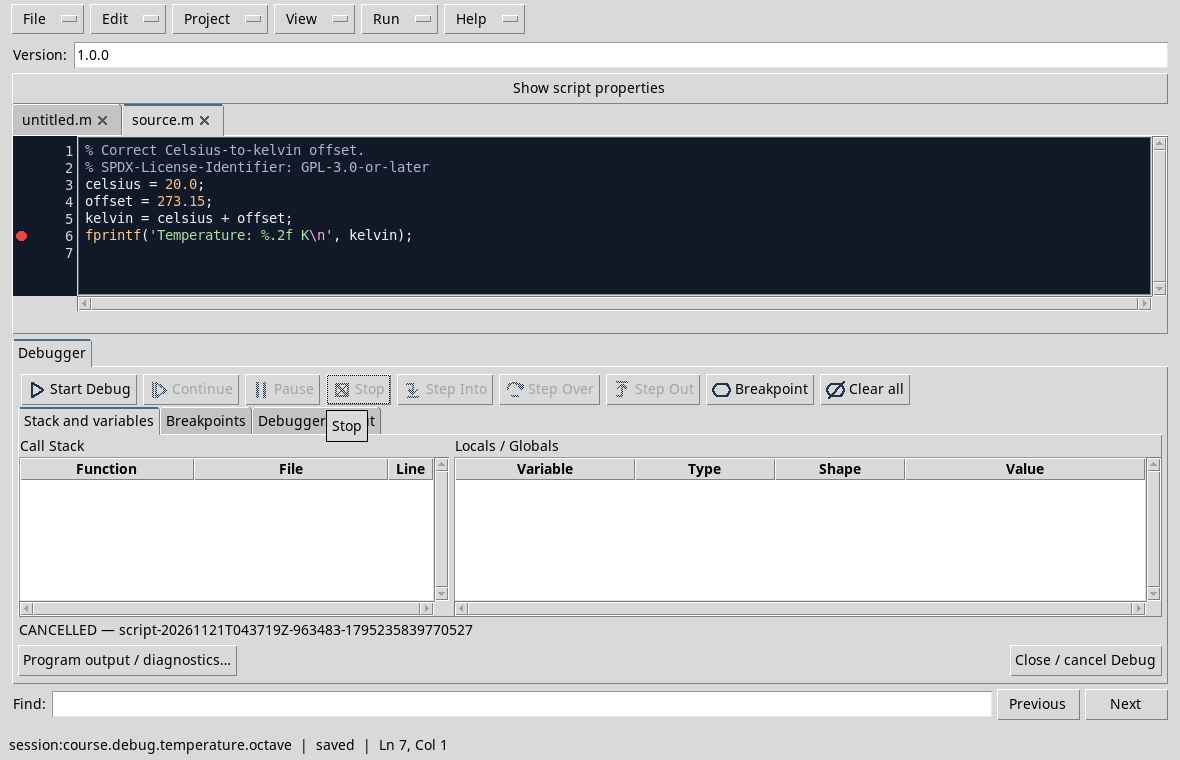
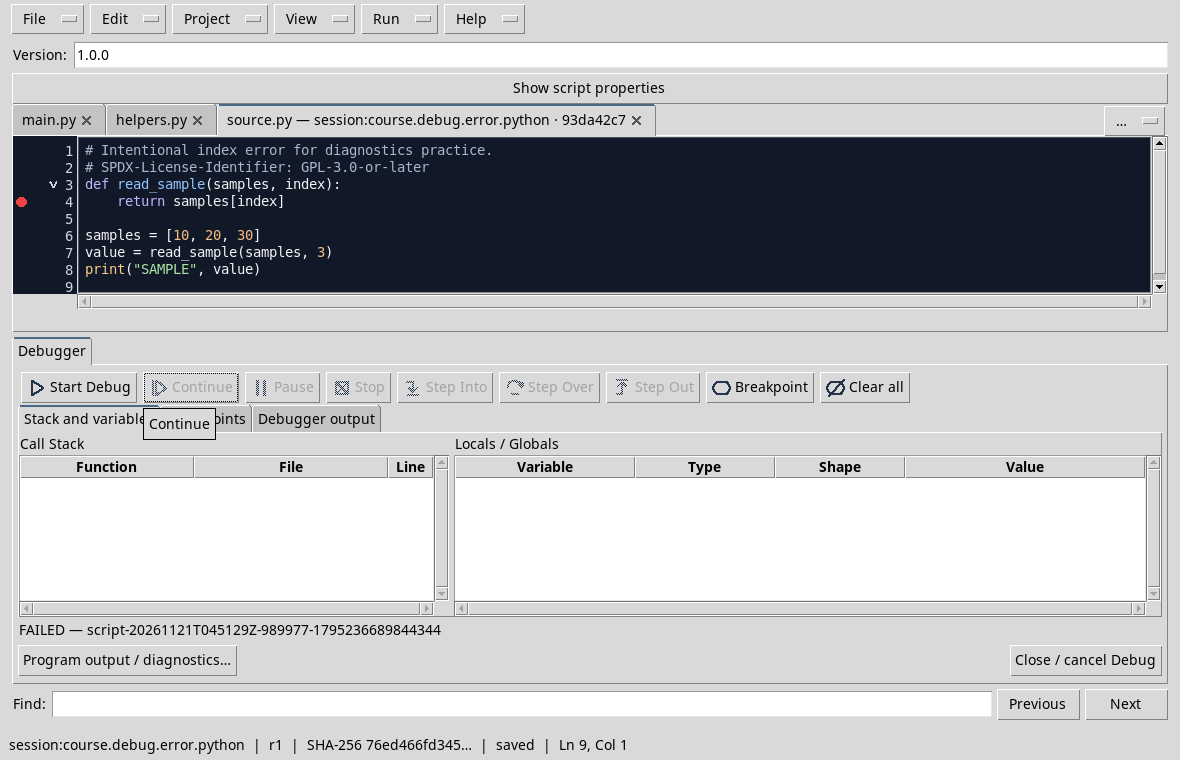
A COMPLETED conclusion does not prove by itself that a scientific result is correct: it compares the result with an independent waiting. FAILED requires you to read diagnosis and stderr; do not automatically assume that any failure has the same cause. CANCELLED reports the cancellation of the test, not a complete verification.
Exercise
A program prints a wrong number but ends with COMPLETED. Is the problem solved?
Worked solution
No. COMPLETED describes the conclusion of the execution, not the correctness of the result. Play the case, check data, assumptions and steps, and compare with the expected value.
Course index · Previous lesson
This reading becomes more useful when we apply it to the typical errors of individual languages. Let’s start with Python.
Previous: Module 03 · 10-module course contents · Next: Module 05
Other steps of this project
- Debugging GNU Octave in GX-TXT: Breakpoints, Variables and Public APIs
- GX-TXT Debugger · Module 08 — Projects, revisions and Sessions
- GX-TXT Debugger · Module 09 — Integrated practical cases
- GX-TXT Debugger · Module 10 — Independent debugging and the final project
- GX-TXT Debugger · Guide 05 — Debugging scientific data: vectors, structures and Datasets
- GX-TXT Debugger · Guide 06 — Debugging a complete scientific workflow