

Correct and publish a verified table
An automatically recognized table is not necessarily ready for scientific analysis. With GX-TXT Unified Documents 1.2.0 you can examine cells in the Editable table (Enter / Escape) area, correct labels and symbols by comparing them to the original document, and publish a result as Canonical Session Dataset.
We will continue with the ZH0371BH001-01A electronic datasheet. We will only correct errors found on the original page, keep the electrical values unchanged and verify the publication in table.generic format. An important point: the PDF uses two lines of bilingual header, while the publication of the viewer can designate as header only the first.
1. Purpose of work
The Tables tab allows you to switch from extraction to revision and publication. The difference between the three operations is crucial: Extract table reconstructs a draft; revision intervenes on cell text; Publish table produces a new Dataset.
A correct publication must retain the identity of the source, table structure, and meaning of values, without automatically attributing a numeric type to strings that contain symbols or formulas.
2. The reference document
The reference is the manufacturer’s datasheet ZH0371BH001-01A, a 13-page PDF with text in English and Simplified Chinese.
For this procedure we use the table 2.1.2 Electrical Characteristics, printed on the physical page 4 of the PDF. It distinguishes parameter, symbol, minimum value, typical, maximum and unit.
3. Open a canonical PDF source
Import the PDF via the normal GX-TXT capture tool, which records the source in the Session as Dataset document.pdf. Then open Viewers → Unified Documents, select the Dataset in Source and press Open source.
The extraction will work on that identifiable document, not on a copy of text pasted into the editor. The original PDF remains separate from the result we will publish.
4. Locate the page and PPE
On the PDF / Image tab set Page = 4 and DPI = 200, then press Render page.
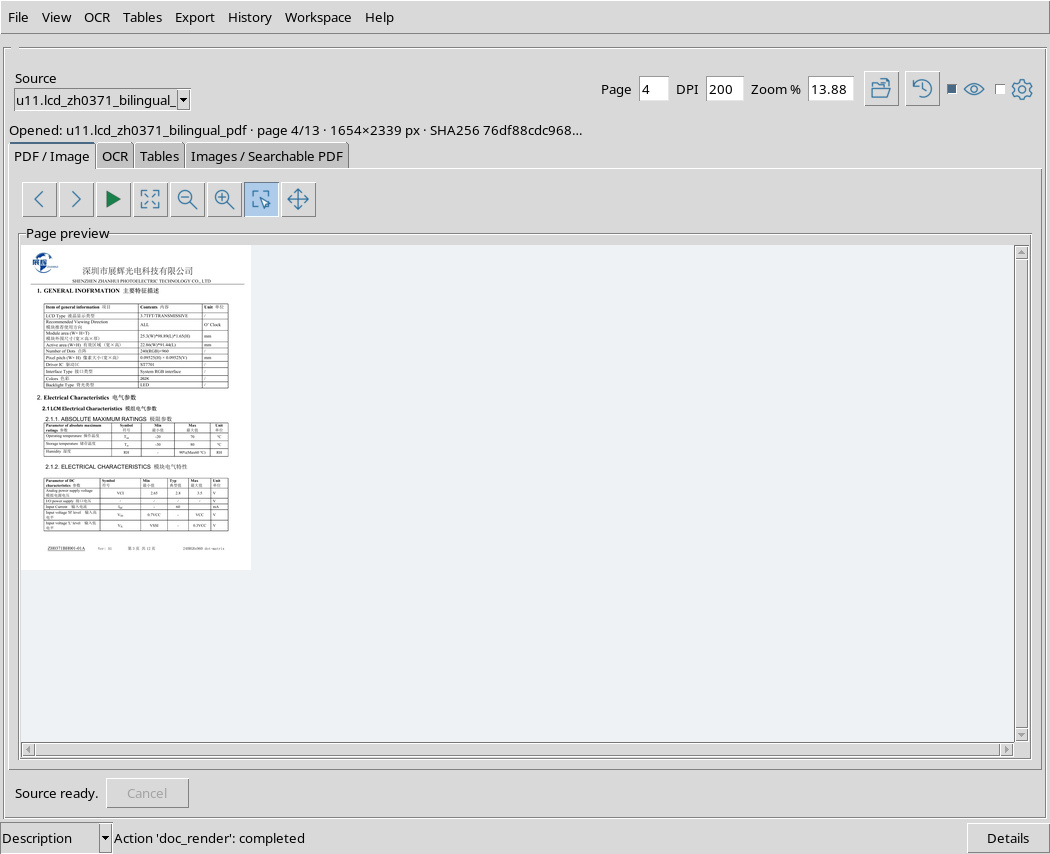
Check that the page displayed matches the electric table. The manufacturer’s printed internal numbering may not match the physical location of the page in the PDF.
5. Select only the useful table
Activate the Region tool and drag the mouse around the 2.1.2 Electrical Characteristics table only. Include headers and five lines of values, avoiding the other sections of the page.
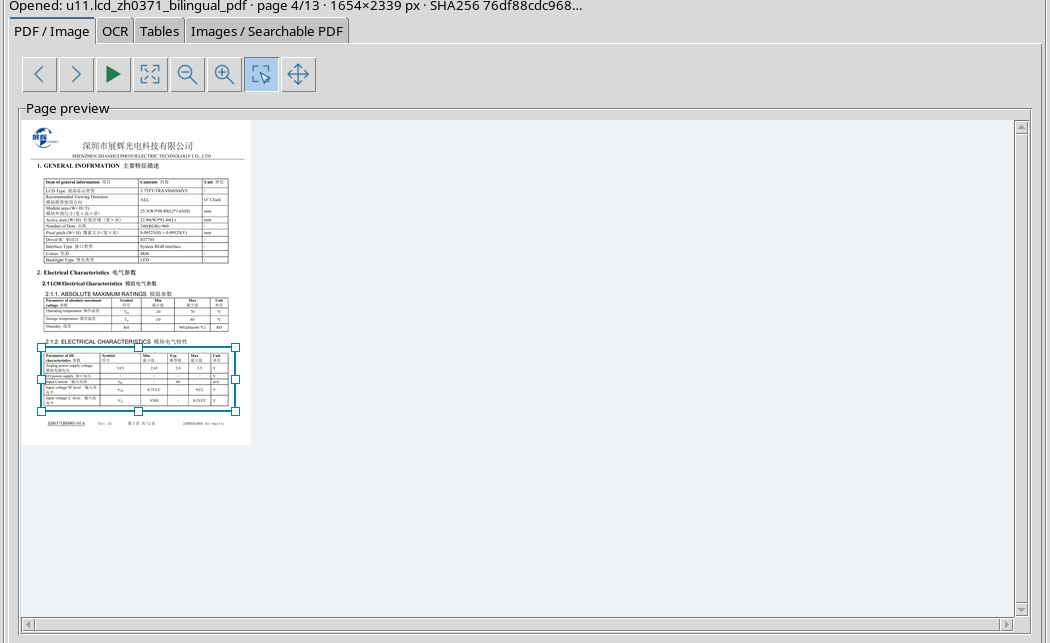
The rectangle displayed in the preview represents a portion of the source page. Selection reduces the risk of confusing columns belonging to different tables.
6. Configure the Tables tab
Switch to Tables and, if necessary, expand Options. Choose Table workflow = Document Tables, Expected columns (0=auto) = 0, Table number = 1 and keep selected First row is header.
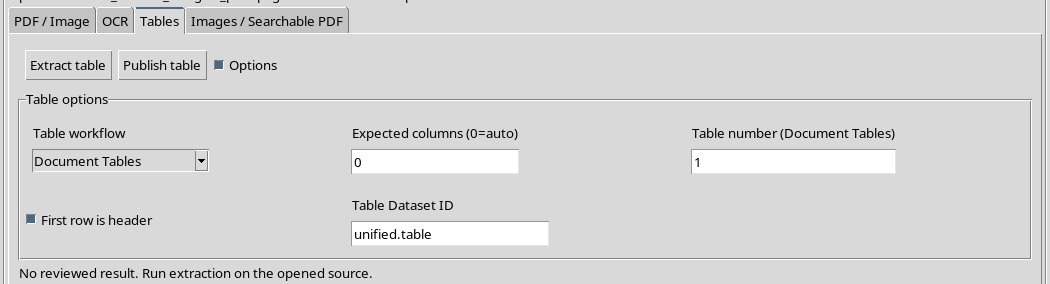
The 0 option leaves the task of deducting columns to the engine. The selected region counts more than just the numerical parameter: on the entire page this same document can produce an inadequate column structure.
7. Perform extraction
Press Extract table and wait for completion. the viewer places the result in the Editable table (Enter / Escape) grid, where you can scroll through the lines and select cells.
The operation is not equivalent to Publish table: the result remains a revision associated with the source and page.
8. Check the actual size
In our example, from the correct region were reconstructed 7 rows and 6 columns: two lines of headers and five lines of data.
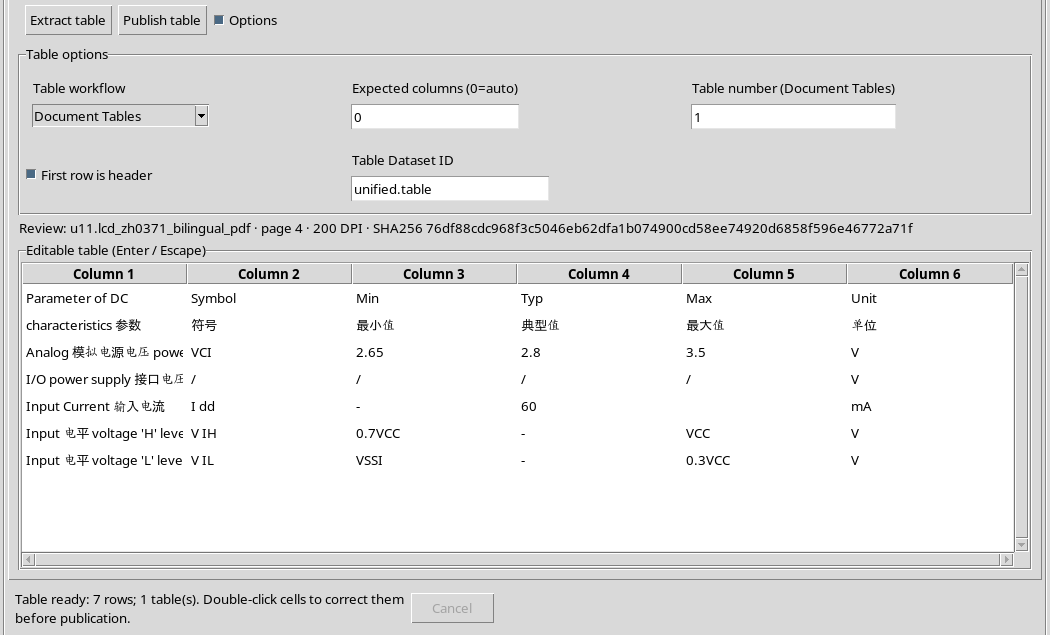
The mere presence of six columns does not guarantee that all letters are correct. Compare headers and values with the original page before accepting reconstruction.
9. Recognize the double header
The first line contains Parameter of DC, Symbol, Min, Typ, Max and Unit. The second line preserves parts of the Chinese translation: 参数, 符号, 最小值, 典型值, 最大值 and 单位
For a scientific publication it is necessary to distinguish these lines from parameter data. A header translation is not an experimental measure.
10. Check the quantities on the PDF
The producer table shows, among others, the following values:
| Symbol | Min | Typ | Max | Unit |
|---|---|---|---|---|
| VCI | 2.65 | 2.8 | 3.5 | V |
| / | / | / | / | V |
| Idd | – | 60 | (empty) | mA |
| VIH | 0.7VCC | – | VCC | V |
| VIL | VSSI | – | 0.3VCC | V |
The hyphen indicates the sign in the document; (empty) identifies a cell that is actually valueless. Do not replace these elements with zeros or invented digits.
11. Separate textual defects from numerical errors
In our grid some bilingual descriptions were reconstructed with an incorrect order and some symbols contain inappropriate spaces: I dd, V IH, V IL.
The numbers in the Min, Typ, Max columns and units, on the other hand, are already consistent with the PDF for the five lines considered. It is therefore advisable to correct the symbols and labels, without rewriting the verified scientific values.
12. Locate a cell to fix
Click a row and use the selection in the grid to locate the cell exactly. The control is a Treeview with columns displayed as Column 1…Column 6.
Column 1 … 6 labels are editor display headers. You should not confuse them with the first line of extracted data, which contains the original header text.
13. Open a cell with F2
Bring the focus to the first row and press F2. the viewer opens a edit field above the selected cell.
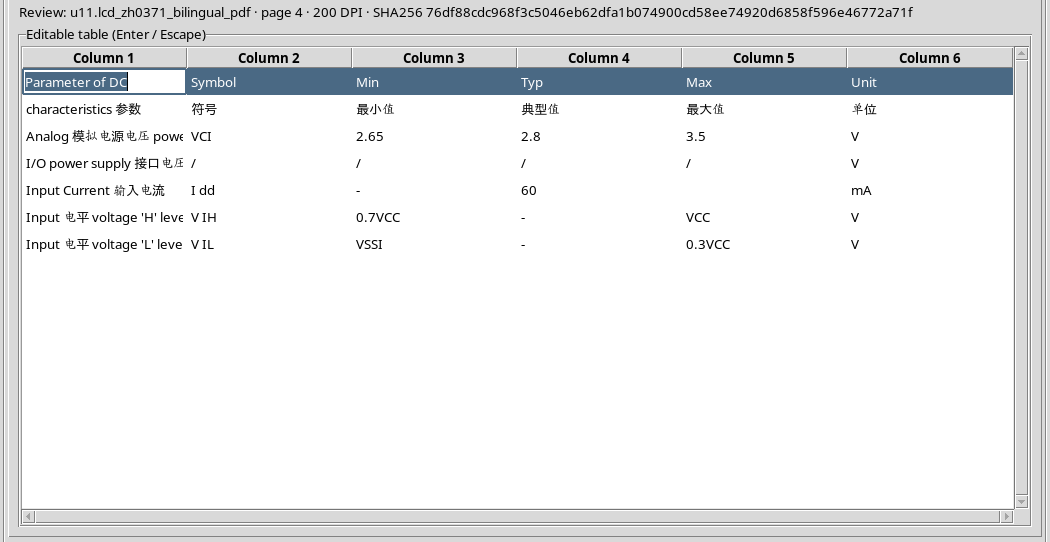
In this example the first cell contains Parameter of DC, while in the original document the complete header is Parameter of DC characteristics.
14. Undo a change with Escape
If you started typing an incorrect value, press Escape before confirming. The editor closes and remains the previous text.
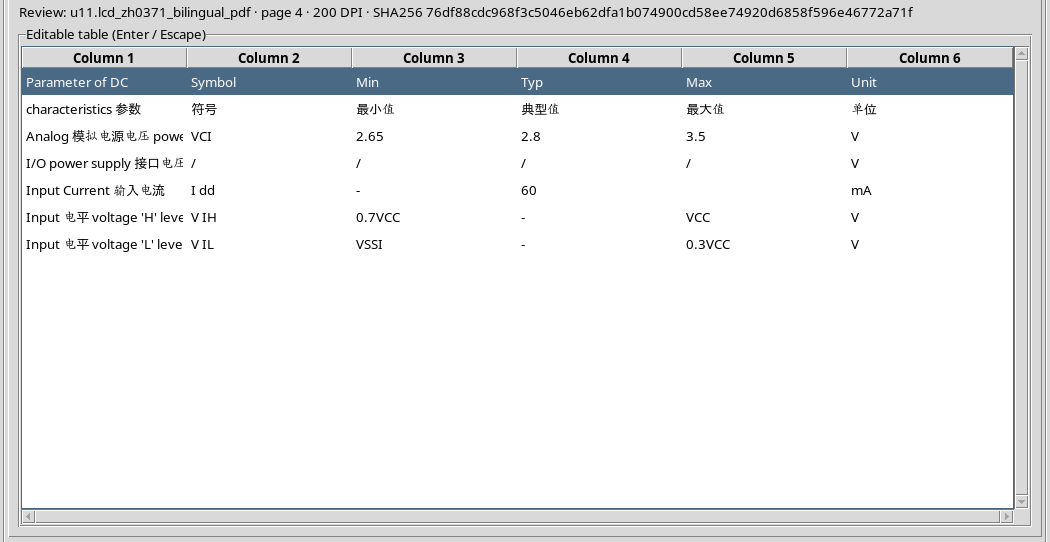
This behavior is useful when a fix has not yet been verified on the PDF page: you can exit the edit without altering the draft.
15. Confirm a change with Return
Reopen the first cell and correct Parameter of DC in Parameter of DC characteristics. Press Return to confirm.
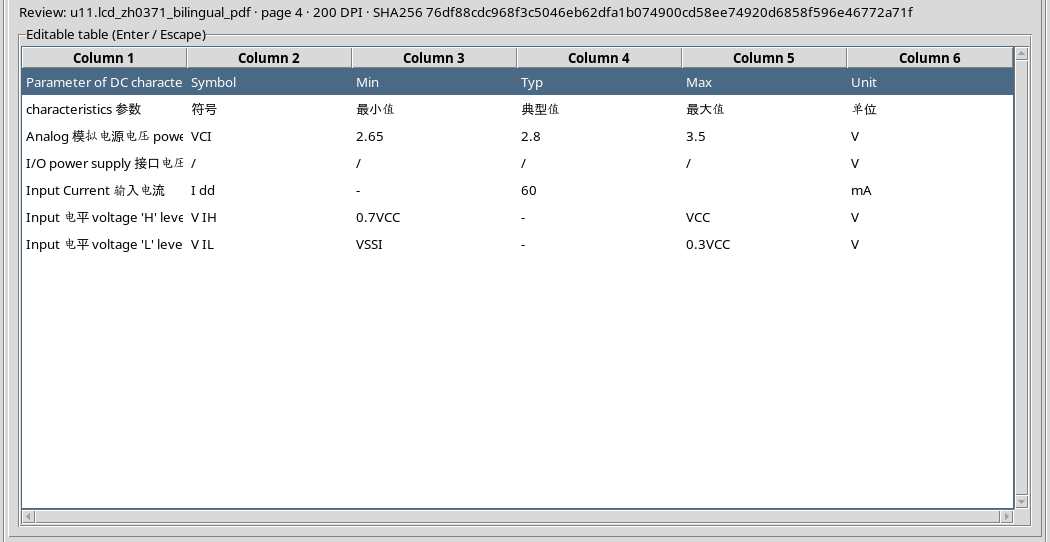
The edit only affects the cell text. It does not rewrite the PDF document or convert the table to a published Dataset.
16. Open a single double-click cell
You can also do double-click directly on the desired cell. For example, in row Input Current the extracted symbol is I dd, while in the original document it is Idd.
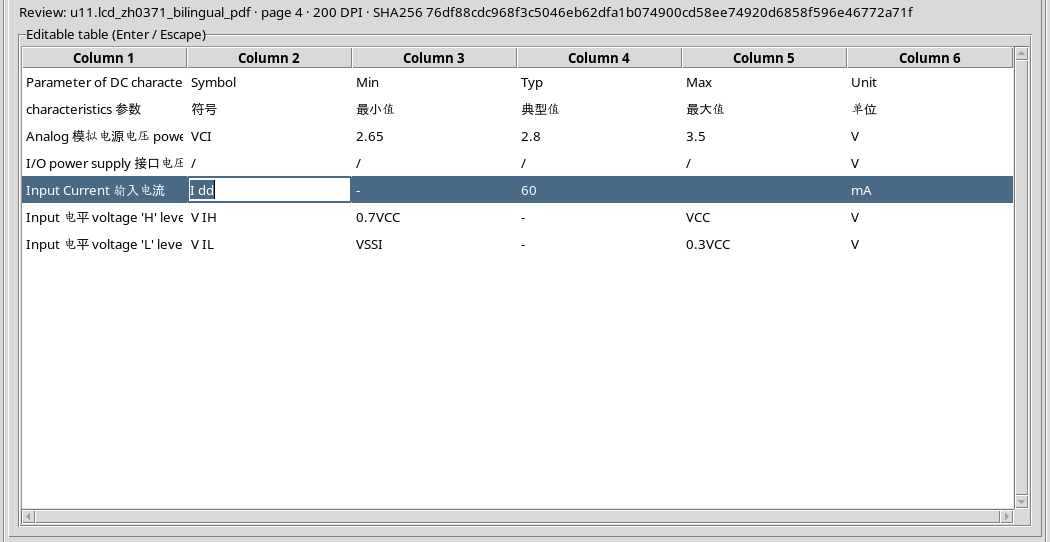
Correct the symbol in Idd and confirm with Return. The edit command acts on the cell, not on all occurrences of the string in the entire table.
17. Move between cells with Tab
In row Input voltage ‘H’ level, correct V IH in VIH, then press Tab. The value is confirmed and the editor moves to the next cell, containing 0.7VCC.
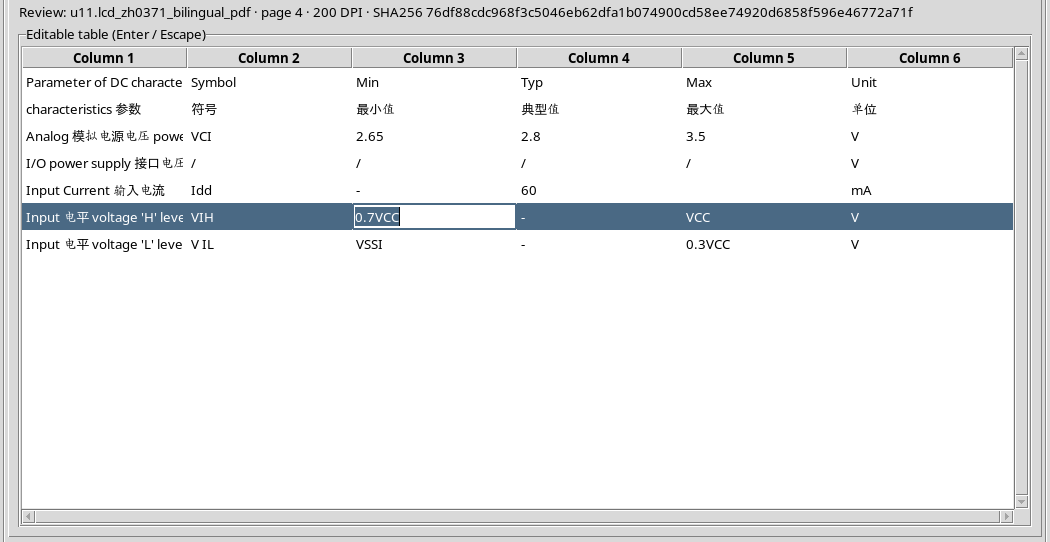
Tab is useful for a left-to-right systematic check, but remember that by advancing you can enter an already correct cell. Do not automatically replace a text formula with a number.
18. Protect the next value with Escape
If you start a modification by mistake in cell 0.7VCC, press Escape. The original value returns unchanged and the cell editor closes.
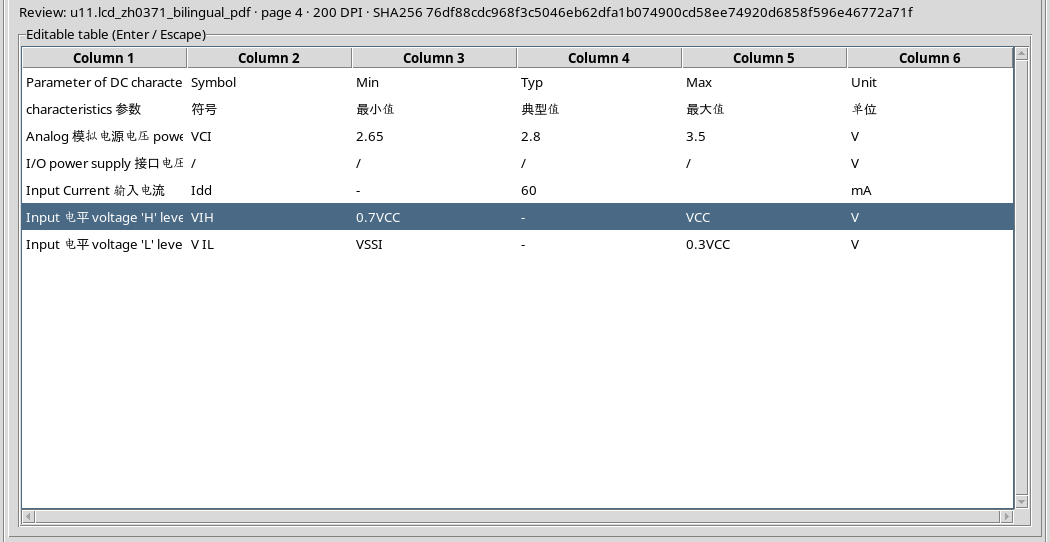
This verification is important because 0.7VCC is an expression that depends on the supply voltage, not an independent numerical value measured in volts.
19. Go back with Shift+Tab
In row Input voltage ‘L’ level, correct V IL in VIL. Pressing Shift+Tab, the change is confirmed and the focus moves to the previous cell, with the parameter description.
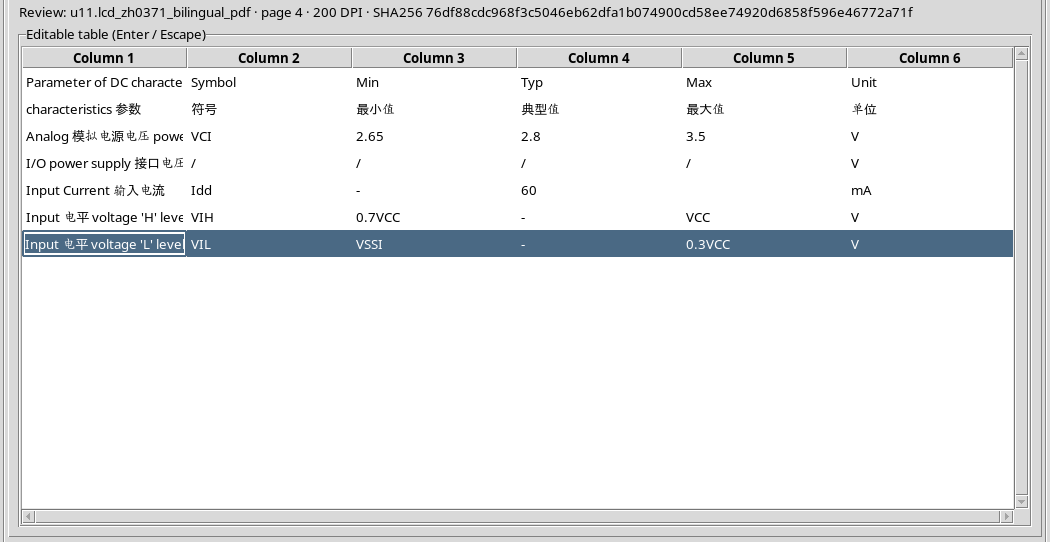
The combination allows you to correct a symbol and then return to its bilingual label. The previous cell can be confirmed later with Return.
20. Rebuild bilingual labels
By directly comparing the PDF you can fix Analog power supply voltage 模拟电源电压, Input voltage ‘H’ level 输入高电平 and Input voltage ‘L’ level 输入低电平.
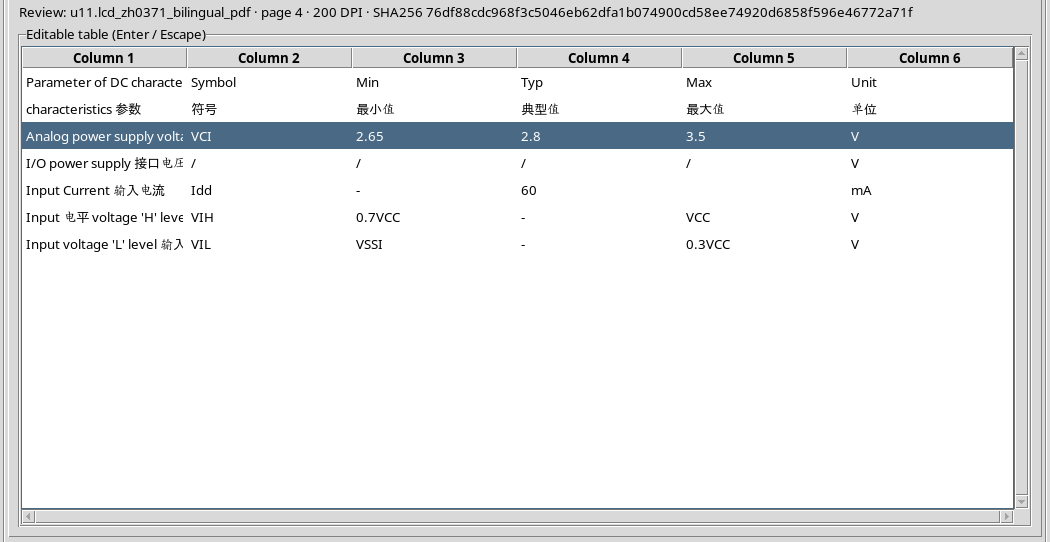
Corrections must reproduce the actually printed content. Do not use the word arrangement proposed by the recognition as a reason for introducing a new technical interpretation.
21. Check table after corrections
After the interventions are completed, the grid maintains 7 rows and 6 columns. The symbols Idd, VIH and VIL are correct; the electrical values remain those extracted from the source.
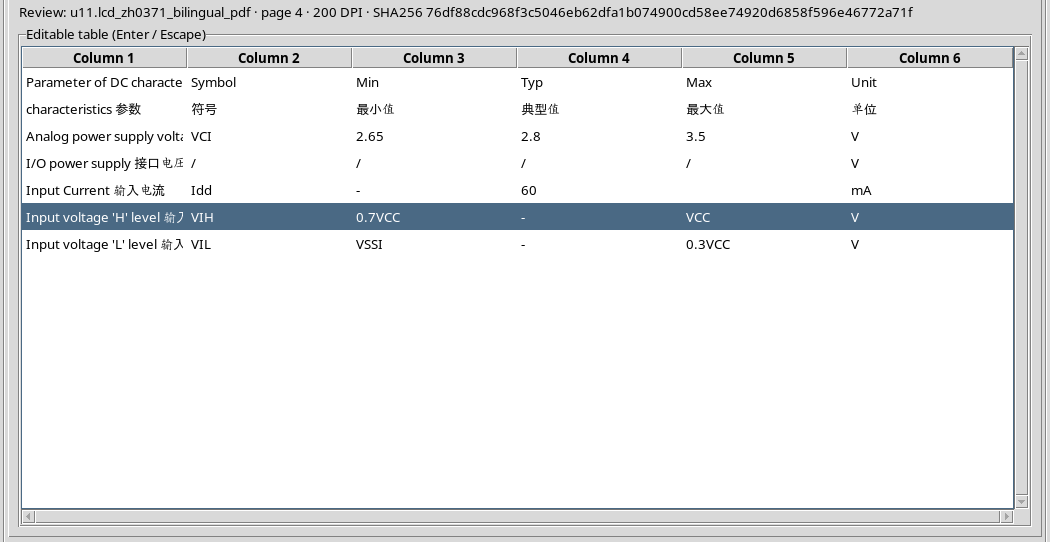
In the example, seven text cells was modified: one header, three symbols and three descriptions. No cells of Min, Typ, Max and Unit columns were changed.
22. The difference between a readable table and a Dataset
The table in the editor is now easier to read. To turn it into a persistent result, however, you need to decide what will be considered header, which rows will remain data and which types can be assigned to columns.
Publish table uses the revised content, but does not automatically guarantee the removal of a second bilingual header line.
23. What First row is header does
With First row is header active, the viewer uses the first row of the reconstructed table to determine variable names. Our example produces the identifiers parameter_of_dc_characteristics, symbol, min, typ, max and unit.
The second line, which contains Chinese translations, is not deleted and will become the first data record. This is a limit to take into account in subsequent processing.
24. Prepare the result name
Open Options and in the Table Dataset ID field enter a descriptive identifier, for example lcd_electrical_characteristics_reviewed. Check that it belongs to the result you want to obtain and that it is distinct from the ID of the original PDF.
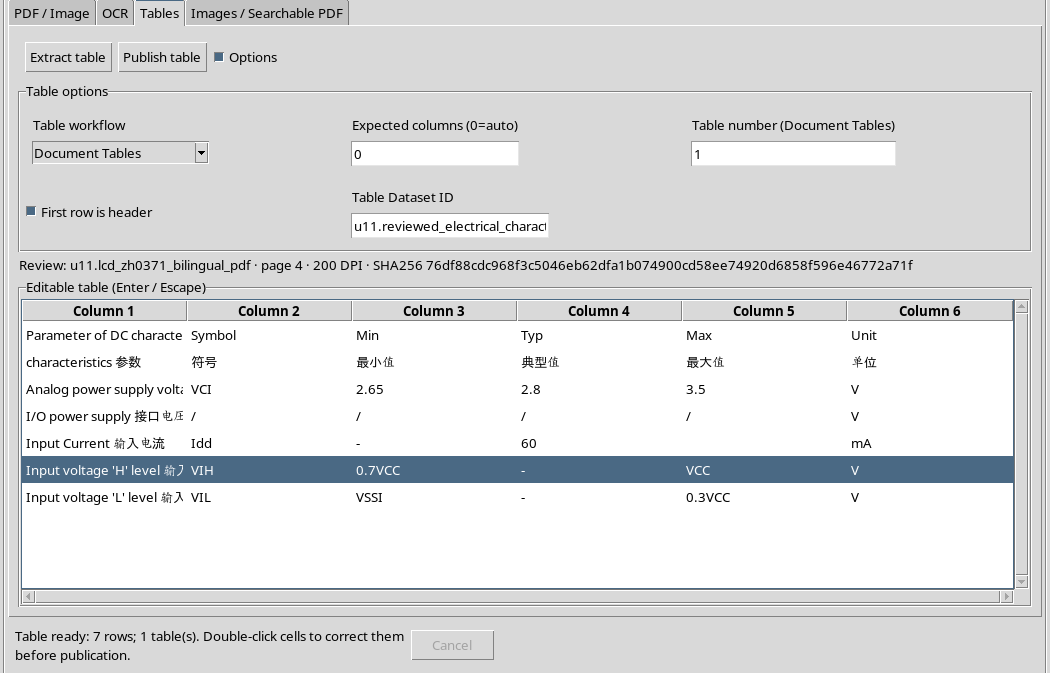
The actual name displayed in the images is derived from the Session of the example and is not a mandatory identifier. Choosing the name does not change cell values.
25. Publish with Publish table
Check that the card shows the correct PDF source, Page = 4, DPI = 200 and the Review: provenance indication. Press Publish table and wait for the operation to finish.
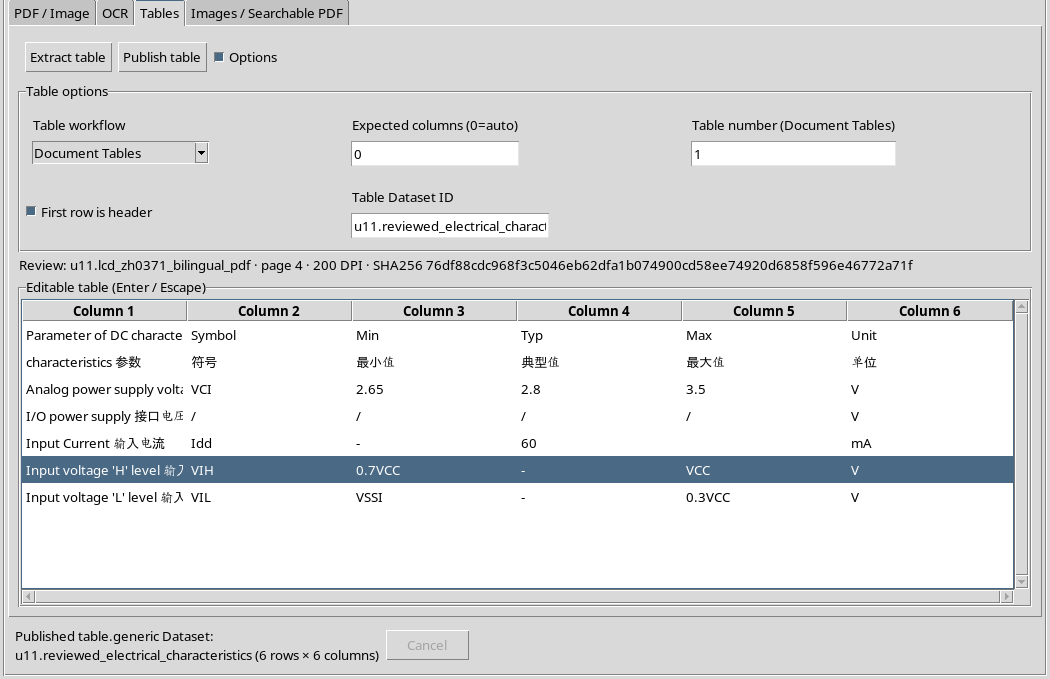
The confirmation of the viewer indicates the creation of a table.generic Dataset in the Session. The PDF source remains available and unchanged.
26. Contract and Dataset format
The result of this example is a canonical Dataset with contract table.generic, stored in CSV. The publication contains 6 columns and 6 data records, in addition to the column names row of the CSV.
Why six records and not five? The first is still the second line of Chinese headers; the other five represent the electrical parameters. This should not be hidden or counted as a sixth measure.
27. Reread the published Dataset
The canonical reading of the variables shows the identifiers parameter_of_dc_characteristics, symbol, min, typ, max and unit, with the five parameters and the revised bilingual labels.
The values 2.65, 2.8, 3.5, 60, 0.7VCC and 0.3VCC are stored in the respective fields. The blank maximum in the Idd row has also remained empty.
28. Because columns are string type
In this case the viewer publishes all six variables as strings. It is consistent with their contents: alongside decimal digits there are Chinese translations, hyphens, slashes, empty cells, symbols and references such as 0.7VCC.
Do not interpret Min, Typ and Max as already validated numeric columns. To perform calculations you must subsequently prepare an appropriate numerical Dataset, distinguishing sizes, units, symbolic references and missing values.
29. The provenance accompanies the result
The Dataset retains the source identity, the SHA-256 fingerprint of the PDF, page number, DPI, normalized region and extraction configuration.
This information helps to find the document from which the table is derived. The correctness of the origin does not replace the verification of individual values and labels.
30. Publication does not automatically correct the original
The PDF is not modified and the revised table is a derivative result. The new Dataset should not be confused with a manufacturer-authorized transcript or a new measurement made in the laboratory.
For later operations, keep the original and document any further transformations instead of hand rewriting the canonical CSV, which already has its own identity and fingerprint.
31. What happens by changing page
If you edit Page from 4 to 5 leaving the revision of the 4 page in the editor, the viewer reports Retained draft — publication blocked. A new attempt to publish the draft on that context is rejected.
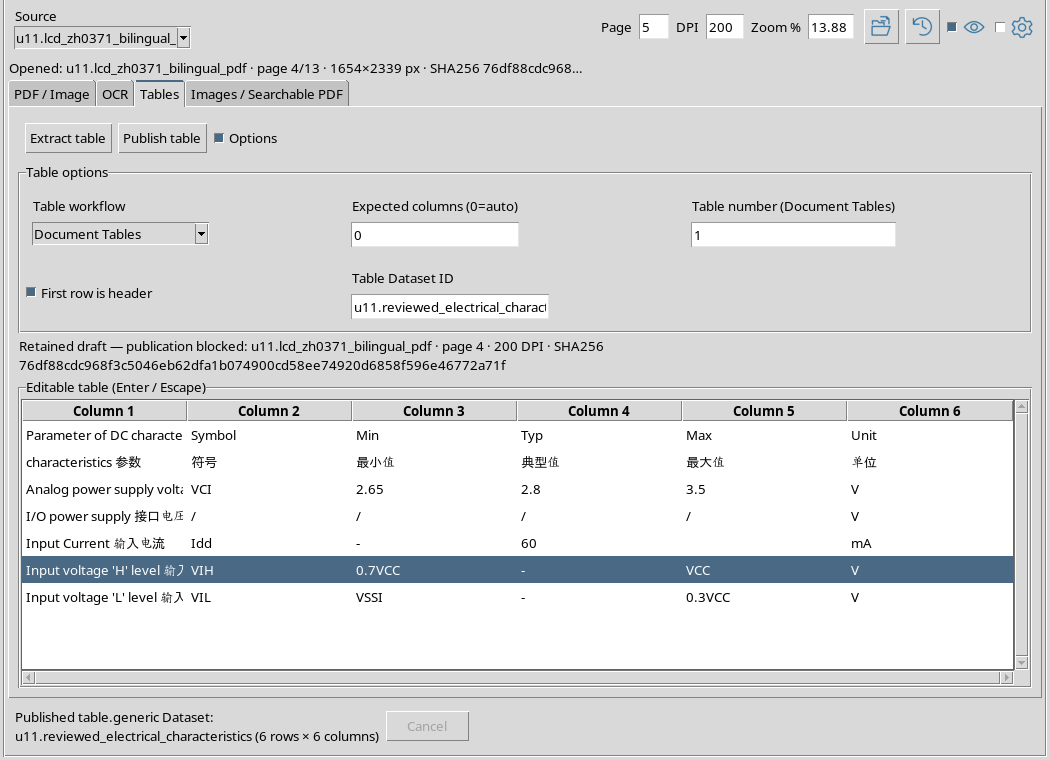
The already published Dataset remains unchanged. Protection avoids attributing the same electrical values to a different page in the document.
32. Restore original provenance
Report Page = 4, maintaining the same source and DPI = 200. The field change only restores page correspondence, but the visual message can still report Retained draft — publication blocked, because a new rendering has not been performed.
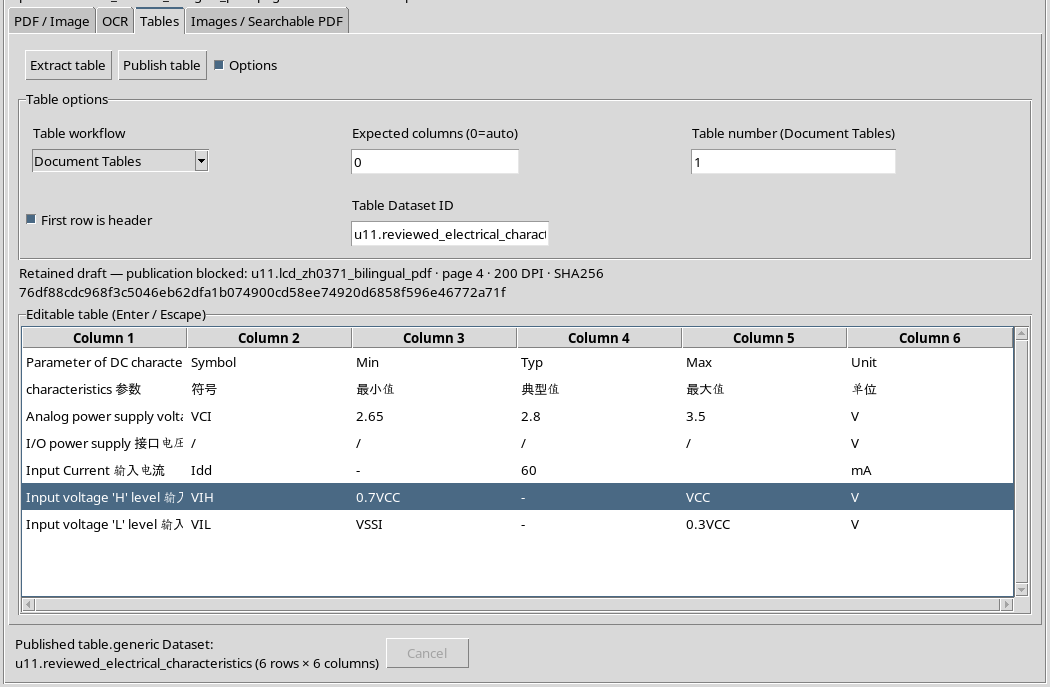
To actually update the message, switch to the PDF / Image tab and press Render page, then return to Tables. Now the Review: indication is consistent with the preserved table.
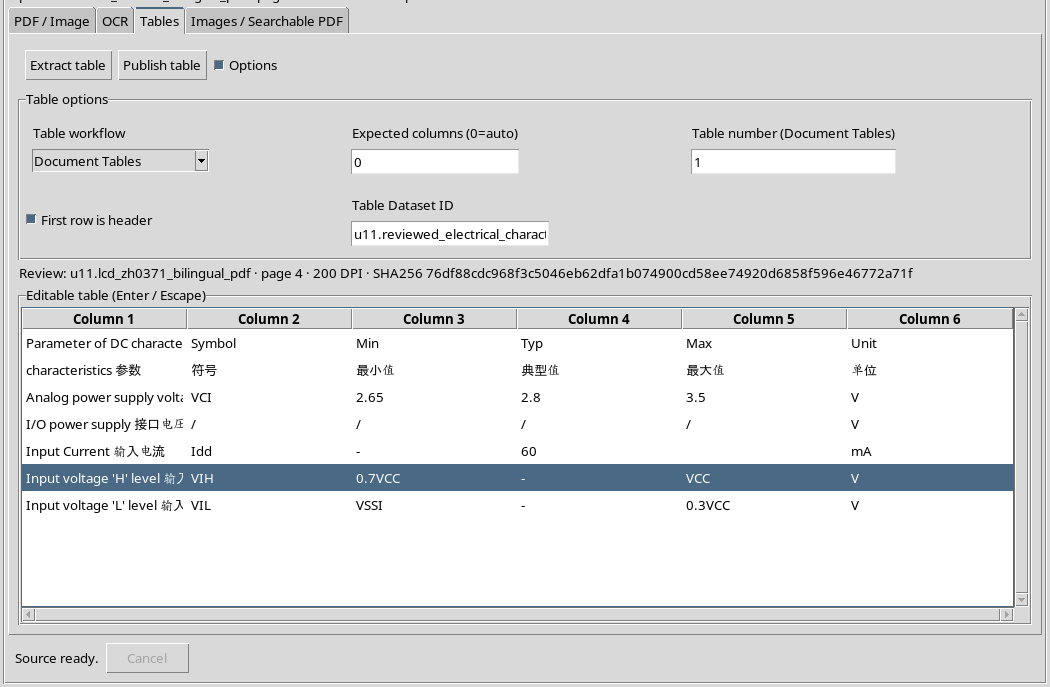
Render page recreates the preview and can reset the drawn region. If you need to start a new regional extraction, check and, if necessary, reselect Region. The already published canonical Dataset remains unchanged: you don’t need to republish it just to update the view.
33. How to treat the second line of header
For later scientific use, the row with 参数 / 符号 / 最小值 / 典型值 / 最大值 / 单位 must be recognized as part of the bilingual header and not as a row of measured values.
The current editor of this workflow allows you to fix individual cells, but we have not performed or documented a line deletion through a GUI command. If you need to produce a result consisting only of the five rows of data, use later processing via the public tools or APIs GTX-TXT, preserving the original published Dataset.
34. Final checks and limits
Before reusing a table, check structure, symbols, numbers, units, header lines, Types of Variables and provenance. In our example the twenty Min/Typ/Max/Unit cells of the five electric lines were compared to the original PDF and stored without modification.
The result is a canonical table true to the revision carried out, but still contains the second header between the data and all columns are strings. Do not present it as already cleaned numeric Dataset.
The next chapter of the guide will address Images / Searchable PDF, to publish an image of a region or an entire page in canonical form.