

Extract and verify a scientific table
the viewer Unified Documents 1.2.0 by GX-TXT allows you to reconstruct tables from a PDF or image and examine their contents in the Tables tab. The original arrangement in rows and columns is however as important as the recognition of words: a numeric data readable, but placed in the wrong column, can become scientifically unusable.
We use a real electronic datasheet with simplified English and Chinese text. We will compare a first extraction of the entire page, which loses the structure of the table, with an extraction limited to its region: the second result preserves the six columns and allows you to verify one by one the main electrical values. In this chapter we will examine the cells without modifying or publishing them.
1. What we want to achieve
The goal is to reconstruct a table of electrical characteristics by preserving parameter, symbol, minimum, typical, maximum and units of measurement in distinct columns.
Before we think about publishing, we will check in the Editable table (Enter / Escape) grid that each value belongs to the correct row and column. The extracted text must not replace the original document as a reference.
2. The original datasheet
The document used is the manufacturer’s datasheet ZH0371BH001-01A, relating to a TFT display. The PDF contains 13 physical pages and includes technical descriptions in English and Chinese.
The physical page 4 reports, among other things, the operating data, the Absolute Maximum Ratings and the table 2.1.2 Electrical Characteristics. The numbering printed on the page may be different from that of the PDF file.
3. Import a canonical source
Import the document into the Session GX-TXT using the Acquisition Handler PDF, so as to obtain a source Dataset with document.pdf contract.
Open Viewers → Unified Documents, select the source in the Source field and use Open source. The origin remains a Dataset distinct from any derived results.
4. View the correct page
On the PDF / Image tab set Page = 4 and DPI = 200, then press Render page.
The page must be readable in the preview. These controls define the page and resolution used in the next extraction; they are not settings that modify the PDF.
5. Study the table on the document
In section 2.1.2 Electrical Characteristics there are six columns: Parameter of DC characteristics, Symbol, Min, Typ, Max and Unit.
Row Analog power supply voltage shows the symbol VCI and values 2.65, 2.8, 3.5, with units V. These data, together with lines of current and logical levels, provide a concrete reference to judge reconstruction.
6. Open the Tables tab
Select Tables. The command bar contains Extract table, Publish table and Options; the Editable table (Enter / Escape) area is available below.
The extraction command produces a draft to be examined, not an already published canonical Dataset. Publish table will be dealt with in the next chapter, after a revision of the cells.
7. The initial settings
Expand Options and choose Table workflow = Table Extractor and Expected columns (0=auto) = 0. Keep Table number = 1 and First row is header selected.
With 0 you ask the program to infer columns. This value may be convenient for a first test, but it does not guarantee that the original layout will be recognized.
8. First Test: Full Page Extraction
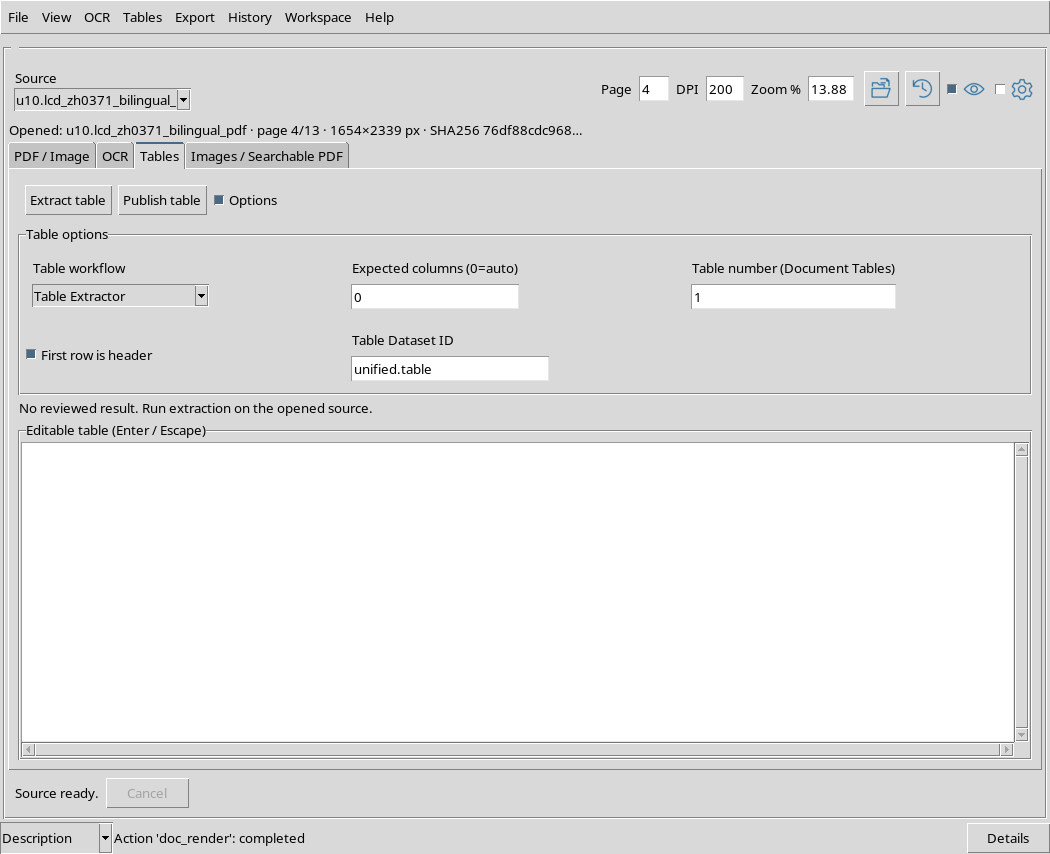
Without selecting a particular region, press Extract table. Wait for the job to complete, then look at the status message and grid.
The page contains multiple sections and multiple table structures. The result can therefore also include general headers, surrounding text, and rows that do not belong to the electric table alone.
9. A seemingly complete, but incorrect result
In the example, with Table Extractor and automatic column recognition, the viewer returned 33 rows and 2 columns.
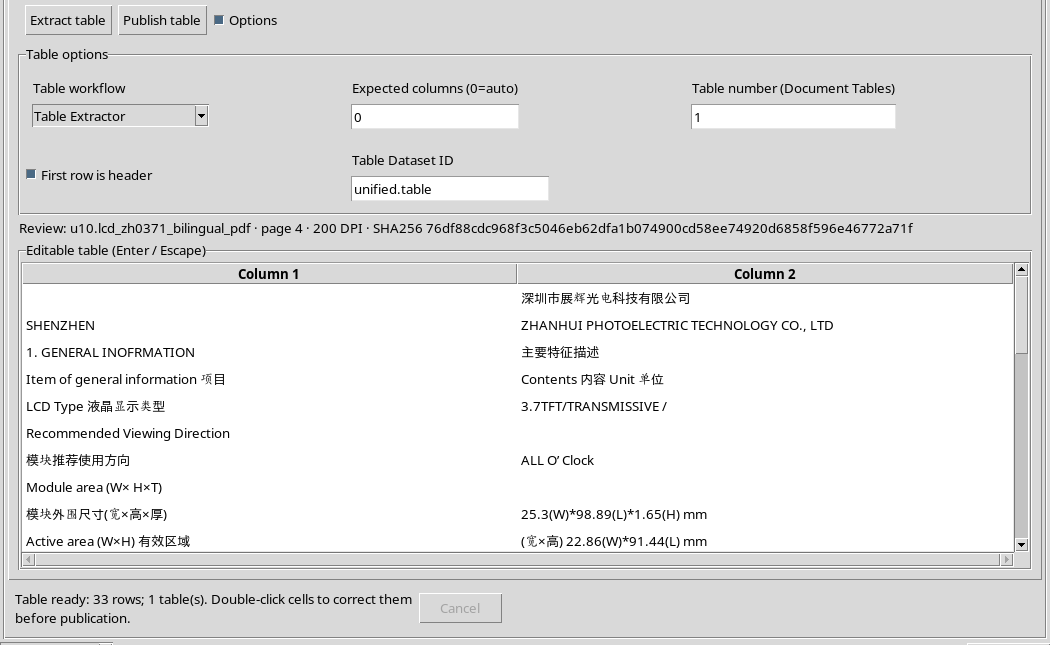
The text contains much of the original information, but does not retain the six-column structure from the Electrical Characteristics table. It is not yet a reliable basis to attribute minimum, typical, maximum and units to distinct numerical variables.
10. The problem of brought together values
The VCI row has been found, but in the second column a string of the type VCI 2.65 2.8 3.5 V appears. The symbol and the four data elements are concatenated into one cell.
The recognition of digits alone is not enough: without the correct subdivision into columns, a subsequent program could not safely associate 2.65 with Min and 3.5 with Max.
11. Select a row in the original grid
Click on the row that contains Analog power supply voltage / VCI. The selection makes it easier to locate the entry and compare the content with the source table.
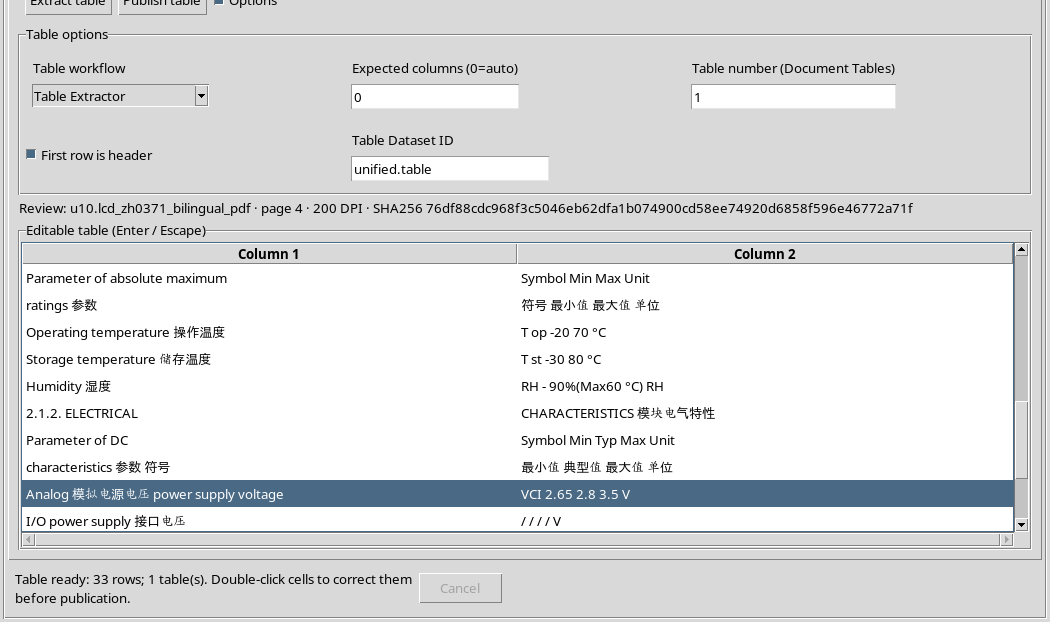
Selecting a line does not correct text and does not create a Dataset. In this first extraction, the line is present but the distribution of its cells remains unsatisfactory.
12. Leave space for important content
When you have finished setting parameters, reclose Options to widen the grid surface.
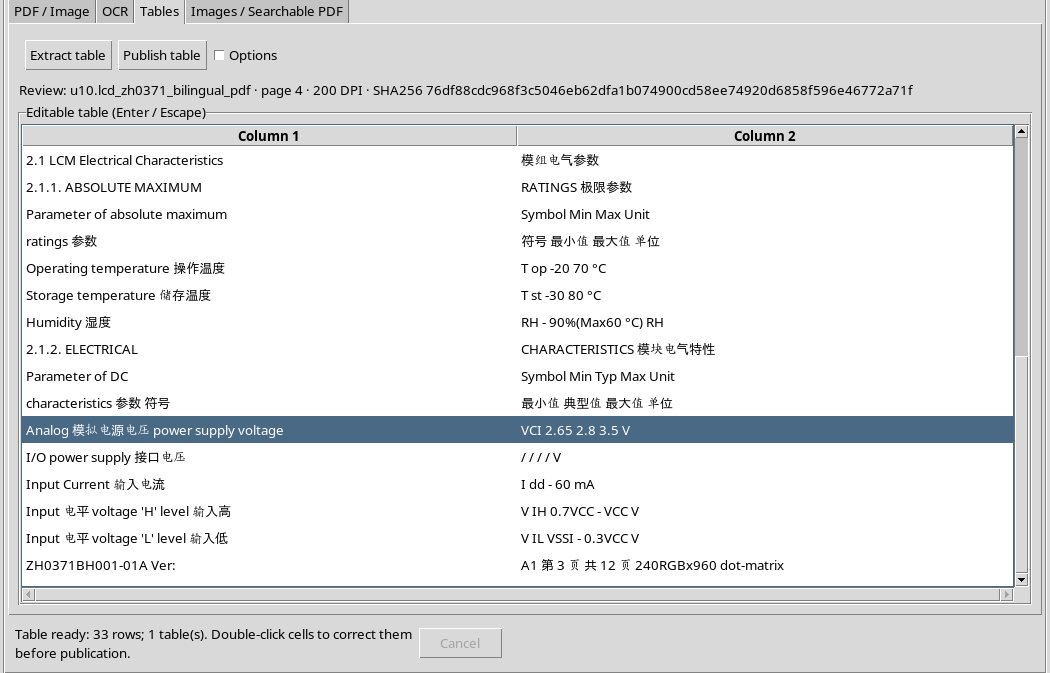
Unneeded panels can remain hidden during revision: in a scientific table it is more useful to display well rows, columns, separators and units of measurement.
13. Try the Document Tables workflow
Display Options and choose Table workflow = Document Tables.
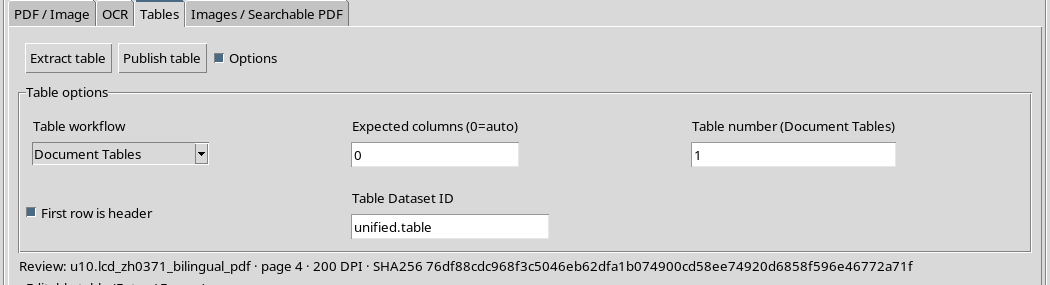
In our document, change only the workflow and keep the entire page does not solve the problem: this mode also returns 33 rows and 2 columns. It is therefore appropriate to intervene on the area of the document to be processed.
14. Why select a region
The 4 page contains a general table with three columns, a table of absolute limits with five columns and an electric table with six columns, as well as titles and notes. Analyzing them all together can confuse the inference of the structure.
Using Region you can only delimit the table you want to rebuild. This way you avoid mixing columns belonging to different sections.
15. Trace Region on Electric Table
Go back to PDF / Image, choose the Region tool and drag the mouse around the table 2.1.2 Electrical Characteristics, including the header row and the five lines of parameters. Avoid including the table of absolute limits that is located higher up.
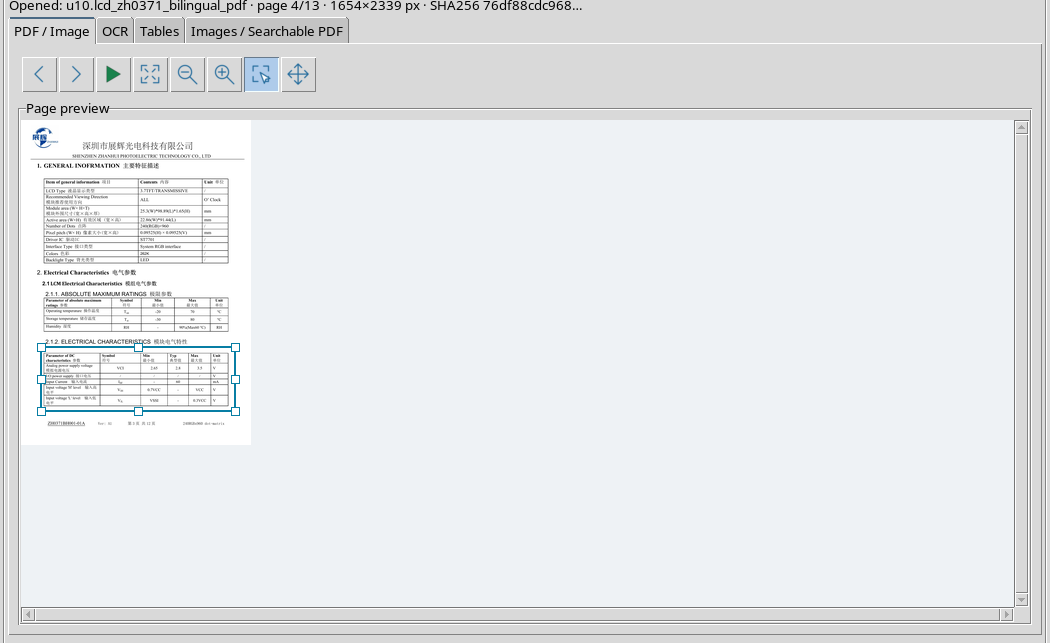
the viewer displays a rectangle with handles on the page. Check that the outline encloses the entire width of the table, including the column of the symbol and that of the unit.
16. A region is connected to the source
The selection corresponds to a portion of the original page, not just a clipping of the image on screen. the viewer retains the coordinates of the region in normalized form with respect to the source.
To repeat the example on another resolution or with a different zoom you have to verify that the region continues to understand the same elements as the PDF. You do not need to edit the original file.
17. Return to Tables with active region
Select Tables again. Set Document Tables, Expected columns = 0, Table number = 1; keep First row is header selected.
The grid can still show the previous result until you start a new extraction. Do not exchange a table left in the editor for the result of the newly drawn region.
18. Extract the table from the selected region
Press Extract table and wait for the new result. The region defined in preview is used as a limit for information retrieval.
In our case the Auto method used native text embedded in PDF (pdf_native). This is a result of document extraction: does not constitute a measure of the accuracy of the Chinese/English optical OCR.
19. The new result: seven rows and six columns
the viewer now shows 7 rows and 6 columns: two lines reporting bilingual header text and five rows of data.
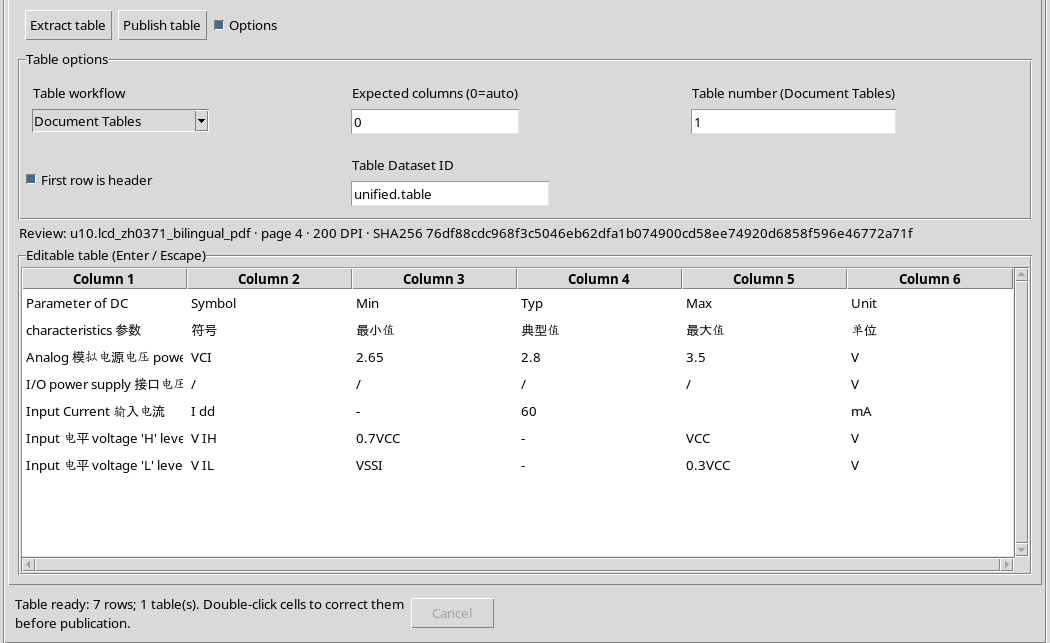
The structure corresponds to the layout of the source table. The transition from two to six columns depends, in this example, on the selection of the correct region; we have not invented cells or manually subdivided the strings of the previous extraction.
20. Read the first row of the grid
The first row of the reconstructed table contains Parameter of DC, Symbol, Min, Typ, Max and Unit. The second row retains parts of the headers in Chinese.
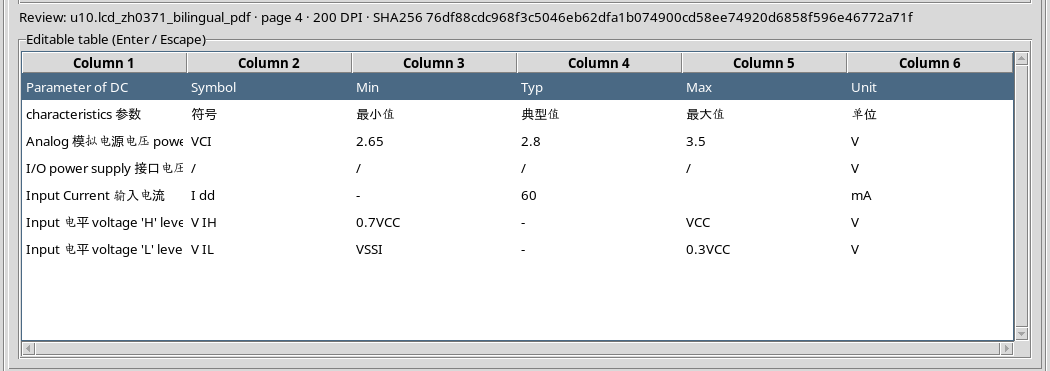
The headers displayed by the Treeview control remain Column 1…Column 6. The First row is header box does not immediately transform the grid names: the interpretation of the headers belongs to the next preparation of the Dataset.
21. Two header lines require attention
In the original document the labels are bilingual and can occupy multiple visual lines. The reconstruction presents them as two distinct lines.
Before publishing a Dataset you will need to decide how to combine or revise them: a simple First row is header applied without verification would risk leaving the second line of header between the data. We will address the correction in chapter U11.
22. Compare VCI with original document
Locate and select row Analog power supply voltage, symbol VCI. Now cells Min = 2.65, Typ = 2.8, Max = 3.5, Unit = V are separated.
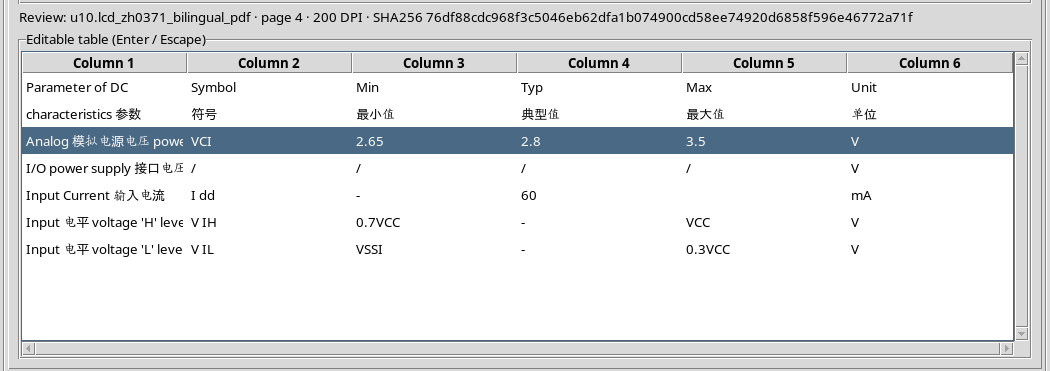
In the PDF the same line shows exactly these values. For a power curve, the distinction between minimum, typical and maximum is essential: they are not three independent measures, but three manufacturer specifications.
23. Check the input current
Row Input Current contains the symbol Idd, a hyphen in column Min, 60 in column Typ, no value in column Max and mA as unit.
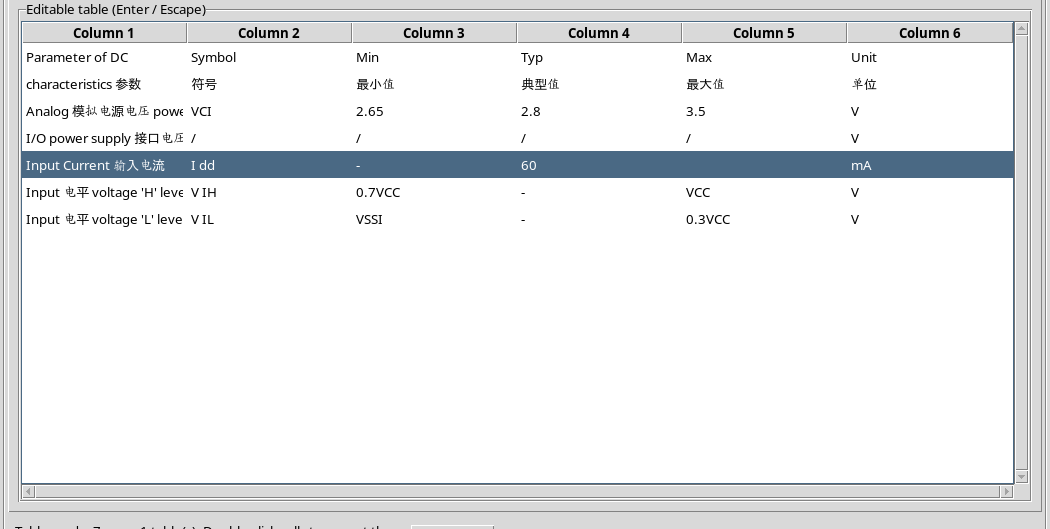
The location of the empty cell is also information: it must not be filled arbitrarily with a zero or another number. In the grid the symbol may appear separated as I dd, particular to be checked before publication.
24. Also check lines with logical layers
For Input voltage ‘H’ level, the source indicates 0.7VCC as a minimum, a hyphen for the typical, VCC as a maximum and V as a unit.
For Input voltage ‘L’ level reports VSSI, hyphen, 0.3VCC and V. These strings must remain such: 0.7VCC is not a pure number and should not be automatically replaced with a decimal value.
25. Punctual comparison with original data
We compared the four columns Min, Typ, Max and Unit for each of the five data rows. The region result contains 20 cells on 20 with the value or text corresponding to the original PDF, including empty cells and conventional signs.
This verification concerns only those 20 cells. It does not prove the correctness of each character of the labels, bilingual headers or any other table extracted with the same software.
26. Where imperfections remain
Some labels have Chinese and English words in non-ideal order; the symbols Idd, VIH and VIL are sometimes broken by spaces (I dd, V IH, V IL).
These are limitations of the reconstructed text, even when the division into six columns is correct. Values must be double-checked on the original page before accepting the table for scientific use.
27. Check the provenance of the revision
Above the grid appears the message Review: with the source Dataset, page, resolution and document fingerprint. This information ties the extracted draft to the source.
If you change page or document, do not automatically attribute lines already present to a different source. Before any publication, double-check that the revision matches the active context.
28. Examine cells without modifying them
For revision only you can click on different lines, use the scrollbars and close Options to increase readability.
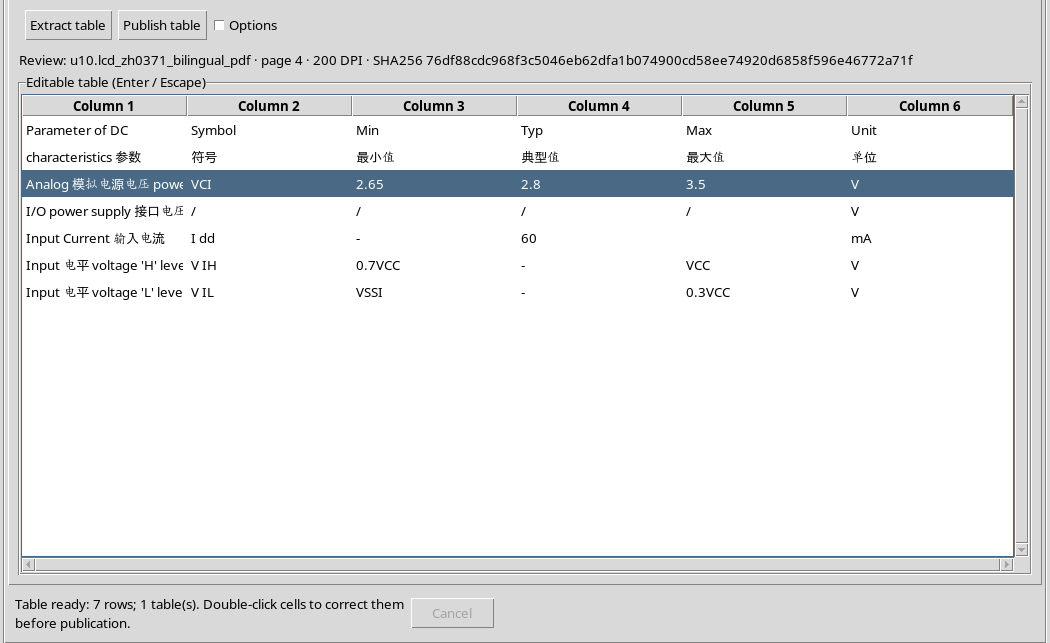
The pane is a data grid, not an image of the table: the selected rows belong to the viewer state. The modification of individual cells, any numeric types and confirmation commands will be treated separately.
29. Keep the result as a verifiable draft
After the comparison is finished, the table remains in the Tables tab with 7 rows and 6 columns and with the provenance associated with page 4, without creating a tabular Dataset yet.
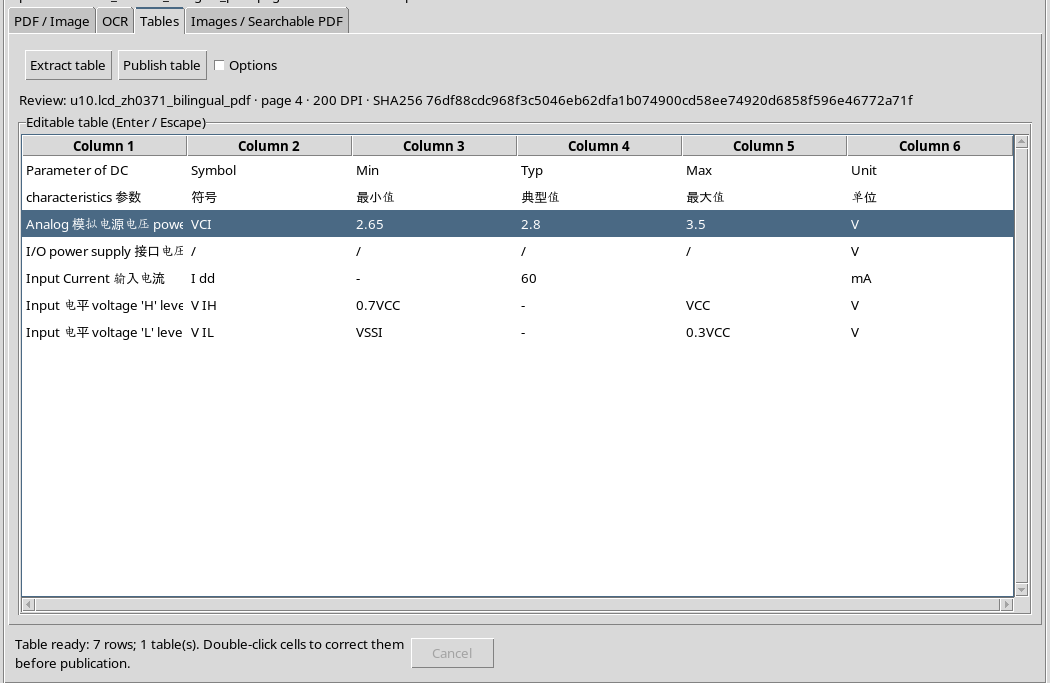
The original PDF remains unchanged. No publication has been performed: at this stage we have only extracted, selected and verified the result.
30. What to do before publication
Before using Publish table you will need to resolve broken symbols, review headers in two languages and check the meaning of the First row is header box.
The next chapter, U11 — Edit and publish a table, will show how to fix cells and how to produce a canonical Dataset by verifying values, structure and provenance. For tables of other documents, do not assume that the same selection rectangle or method produces identical results.