

Choose table extraction options
GX-TXT Unified Documents 1.2.0‘s Tables tab lets you choose how to rebuild a table from a PDF document or image. Before starting processing, you can set the workflow, the expected number of columns, first-line management, table index, and the Dataset identifier to publish.
We use the ZH0371BH001-01A electronic datasheet as a reference, which contains simplified English and Chinese text. In this chapter we configure the controls and check their conditions of use: we don’t extract cells yet and we don’t publish tables. These steps will be addressed in the next guide.
1. Why prepare options before extraction
A table is not just a sequence of words. Rows, columns, headers, and associations between quantities, values, and units must be identified. An optical recognition that seems readable may have lost the original alignment.
The Tables card offers some useful parameters to guide reconstruction. Their settings do not replace comparison with the original document.
2. The reference document
We use the original PDF datasheet ZH0371BH001-01A from the manufacturer, composed by 13 physical pages. The text includes English, Chinese and technical data schematics.
The presence of electrical units, acronyms and tables makes the document a useful example to verify the difference between simple text OCR and data extraction arranged in columns.
3. Import the source into the Session
Import the PDF to GX-TXT via the normal capture tool, so that it is registered as Canonical Dataset document.pdf in the Session.
Open Viewers → Unified Documents, choose the PDF in the Source field and press Open source. Choosing the ID of an existing Dataset keeps the source document identifiable.
4. Open the work page
In the PDF / Image tab set Page = 4 and DPI = 200, then press Render page. The 4 physical page contains display information and sections with electrical features.
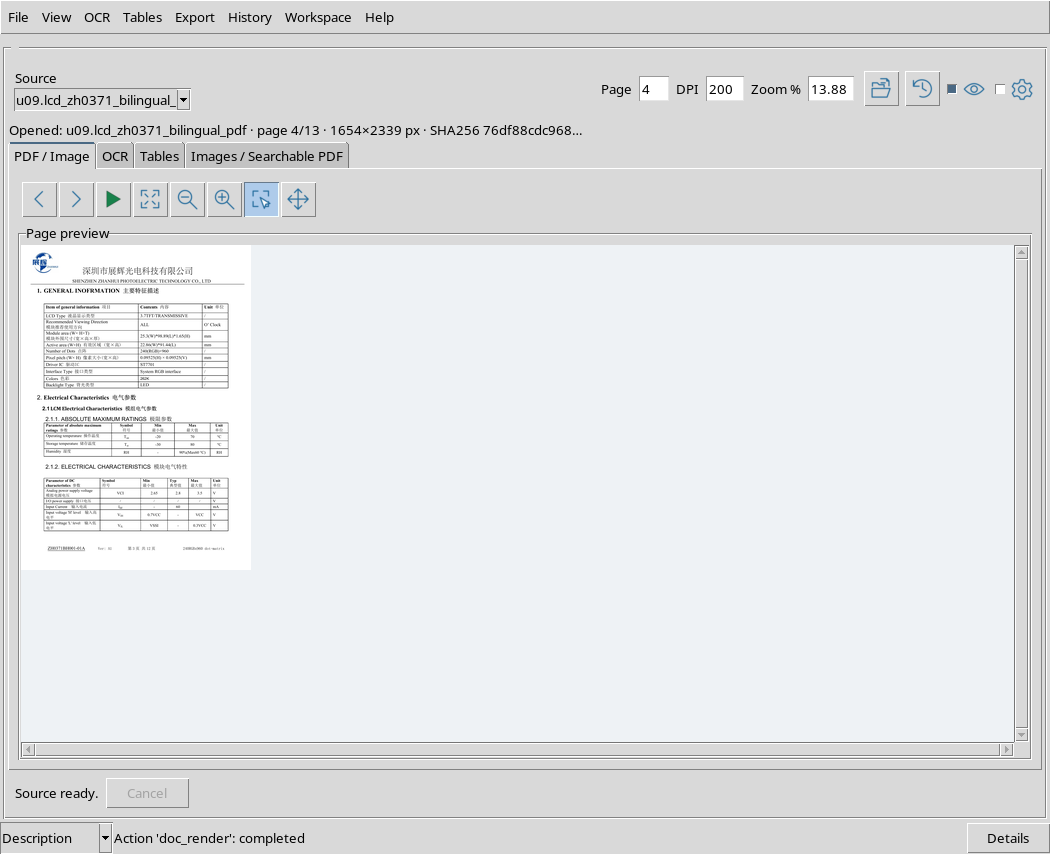
Before evaluating any extracted numbers, always check the arrangement of cells in the source page. The numbering in the Page field is that of the PDF file, which may differ from numbers printed on the page.
5. Switch to Tables tab
Select Tables. The Extract table, Publish table, the Options box, the status message and the Editable table (Enter / Escape) section appear.
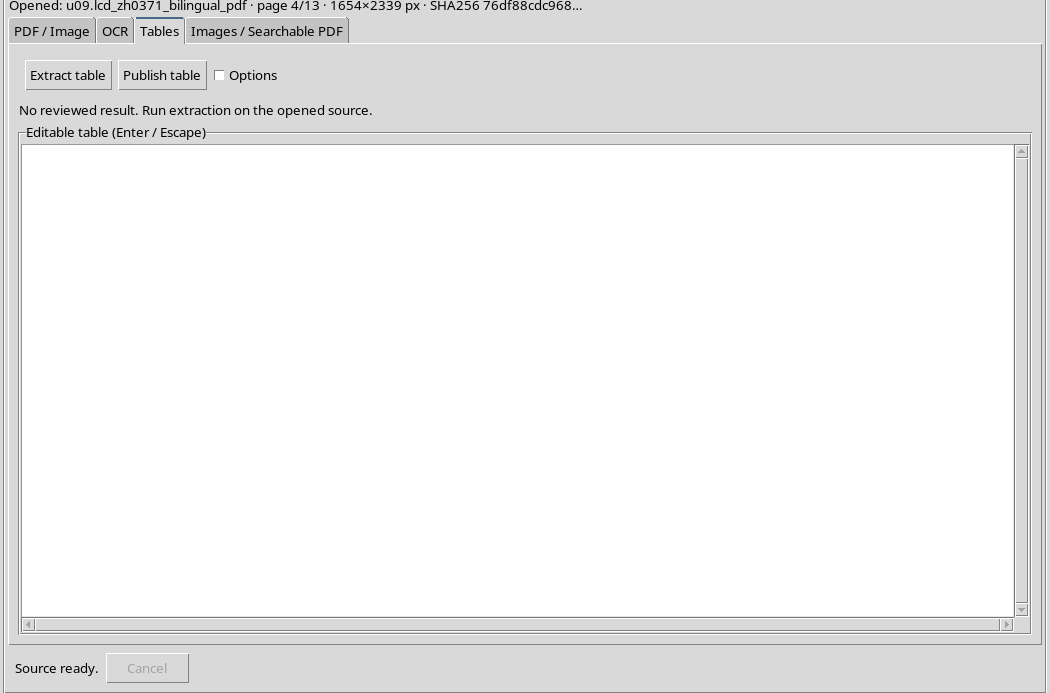
The initially empty grid does not mean that the document does not contain tables: it just means that an extraction for revision has not yet been made.
6. Expand only the necessary options
Activate Options to show the Table options group. The screen keeps extraction controls and grid visible, without having to open all accessory panels.
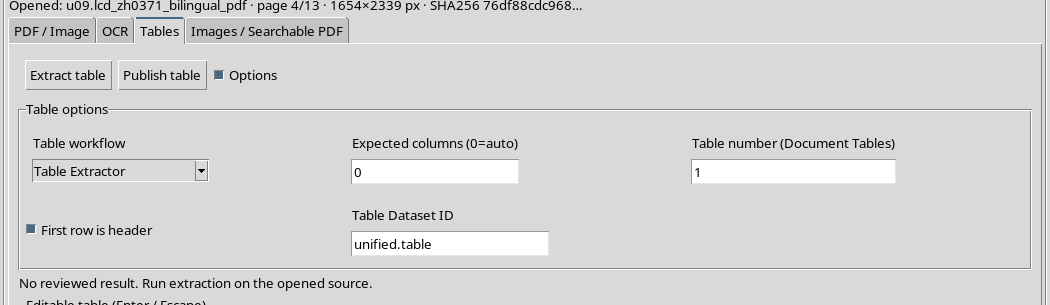
When you need to work with the reconstructed table, you can reclose Options to leave more room for cell revision.
7. Defaults
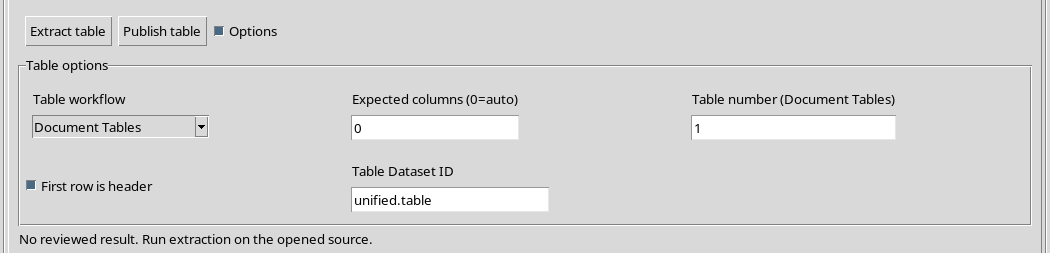
At the section opening, the fields are Table workflow = Table Extractor, Expected columns (0=auto) = 0, Table number (Document Tables) = 1, First row is header selected and Table Dataset ID = unified.table.
These are initial interface values, not PDF analysis results. For example, the number 1 in Table number does not prove that a table has been found.
8. The Table workflow menu
The Table workflow field offers two alternatives: Table Extractor and Document Tables. You can select them in the same drop-down box.
The choice changes the way the viewer will use the table reconstruction service; it alone does not perform a recognition and does not add Dataset to the Session.
9. Choose Table Extractor
With Table Extractor selected, the workflow is geared towards reconstructing a tabular structure with recognizable rows and columns.
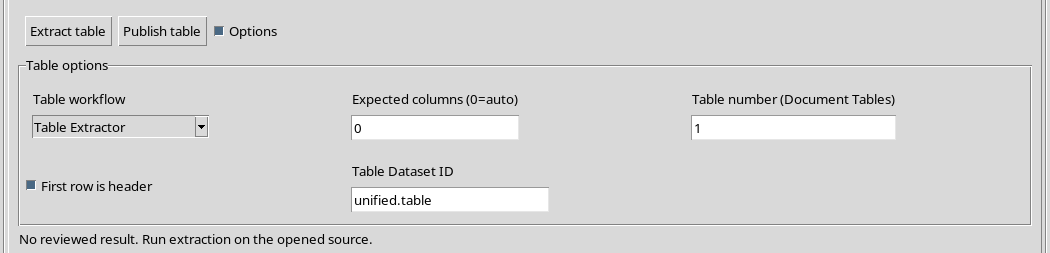
In the version described, this mode also sets minimum criteria to accept a reconstruction with at least two rows and two columns. It does not mean that each document automatically produces a correct table.
10. Choose Document Tables
The second option is Document Tables, which uses the document path to identify tables and allows you to choose a candidate by using Table number.
The presence of this workflow does not guarantee the identification of all PDF tables. Actual limits and results on the datasheet will be evaluated after the extraction, not just the presence of the item in the menu.
11. Difference between workflow and result
Table workflow specifies a method; Editable table will instead contain the actual reconstructed data only when you run Extract table.
Do not use the workflow choice as proof of accuracy. Tables can contain repeated headers, empty cells, broken lines, and numbers confused with surrounding text.
12. Expected columns: the 0 value
Expected columns (0 = car) indicates how many columns are expected in the table. With 0 the system lets the algorithm propose the number of columns.
This is a reasonable starting point when the structure is unclear, but the result should still be examined: automatic inference is not a scientific verification of the data.
13. Expected columns: a positive value
If you look at four well-defined columns in the document, you can try Expected columns = 4. In this example the value was actually entered into the GUI.
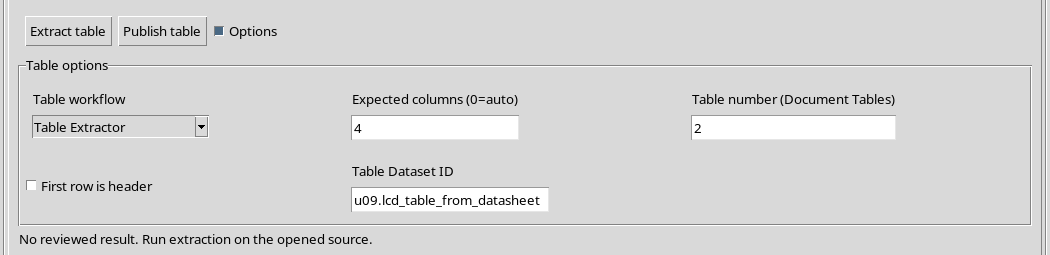
The value does not force to invent missing cells nor does it guarantee a four-column reconstruction. It is an indication used by the extraction engine.
14. First row is header
The First row is header box indicates whether the first row of the reconstructed table should be interpreted as a column header in the next Dataset definition.
When selected, the first line’s texts can contribute to label definition. When unchecked, the first row remains part of the data. It is a choice regarding table interpretation during publication preparation, not an automatic OCR correction.
15. When to uncheck the header
If the first row already contains measures or numeric values, and not column names, turn off First row is header. You will avoid turning a row of data into labels by mistake.
In our example the box was actually turned on and off in the Tables tab, without extracting or publishing a table.
16. Table number: table numbering
Table number (Document Tables) allows you to indicate the order of the candidate to be used: 1 means the first, 2 the second. It is not the number of columns and it is not the page number.
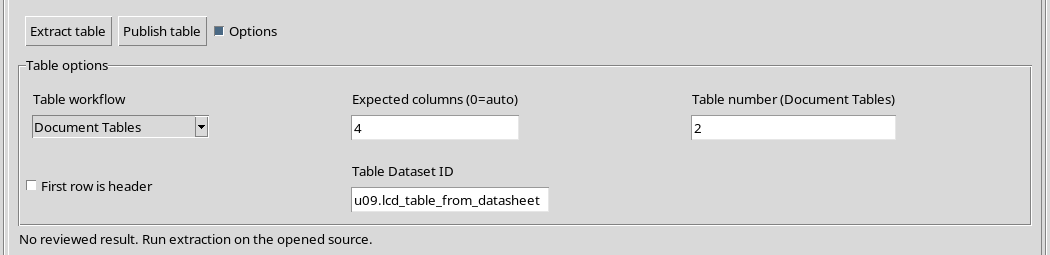
Setting 2 does not prove that there is a second recognizable table in the document. It will be the extraction to determine how many candidates have actually been reconstructed.
17. The Table Dataset ID
Table Dataset ID is the identifier to use for future publication of a tabular result in the Session. The default field is unified.table; you can set a more descriptive ID.
The name is about the new derived Dataset, not the source PDF. Changing it in the GUI, by itself, does not create any results: publishing will require a table extracted and revised.
18. Example of modified configuration
An alternative configuration is Document Tables, Expected columns = 4, Table number = 2, First row is header deselected and a specific identifier in the Table Dataset ID field.
This combination has been entered into the real interface and is useful for understanding the meaning of fields. It does not represent a successful reconstruction of the second table of the datasheet.
19. Back to automatic column recognition
You can bring back Expected columns = 0, Table number = 1 and reactivate First row is header. So you go back to a more general starting setting.
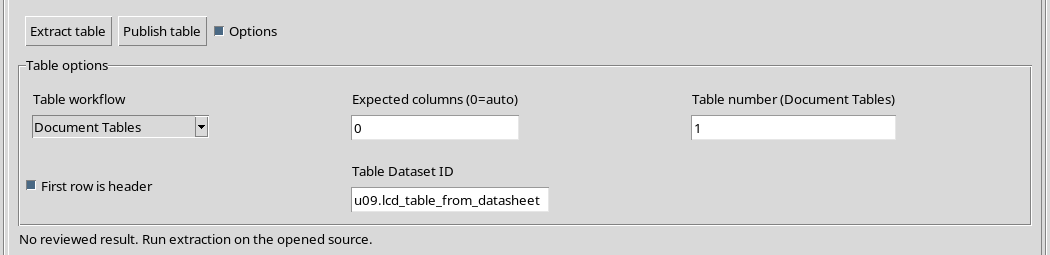
Depending on the document structure, you may need to try different configurations and compare cells with actual rows and units.
20. The role of DPI, languages and region
Tabular extraction uses the current PDF page, recognition settings and any region of interest. For a bilingual document it is appropriate to check OCR languages before extraction, for example eng+chi_sim if an optical path is used.
Selecting a region around the table can reduce foreign text interference. How to track and control Region is explained in the chapter dedicated to preview; here we limit ourselves to the options of the Tables tab.
21. Values not allowed for Expected columns
The validation check involves an integer between 0 and 100 for Expected columns. Negative numbers, values beyond 100 and non-numeric strings are therefore invalid.
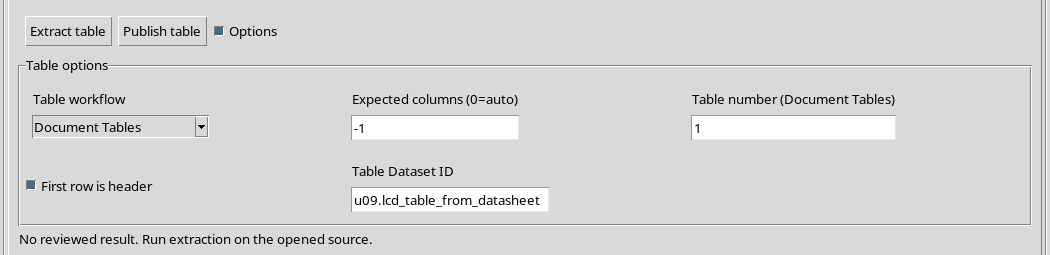
An invalid value can be typed in the field, but the processing command must reject it before starting work. The message indicates the accepted interval.
22. Column number control
In our case the wastes of -1, 101 and abc for Expected columns were verified. All were rejected from the original verification, without starting the process and without creating a Dataset.
The 0 value, on the other hand, is valid and expresses the automatic mode; it should not be confused with a request to extract zero columns.
23. Values not allowed for Table number
Table number must be an integer between 1 and 1000. The value 0 is invalid, because the index of the first table is 1.
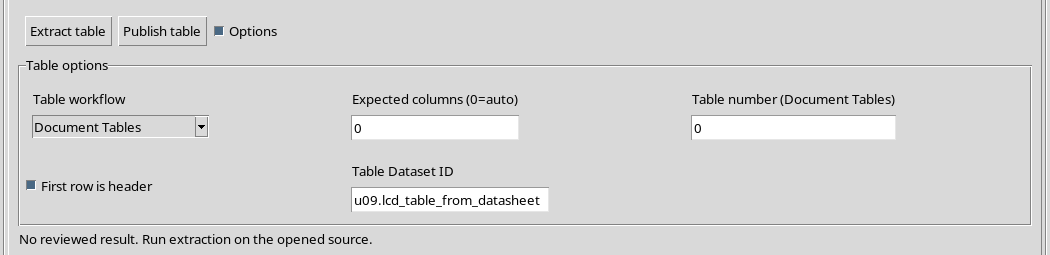
1001 and abc were also checked: the original control rejected all three values, without starting a table reconstruction.
24. Numerical limits and special cases
Syntactically valid extremes are 100 for Expected columns and 1000 for Table number, as verified in the interface.
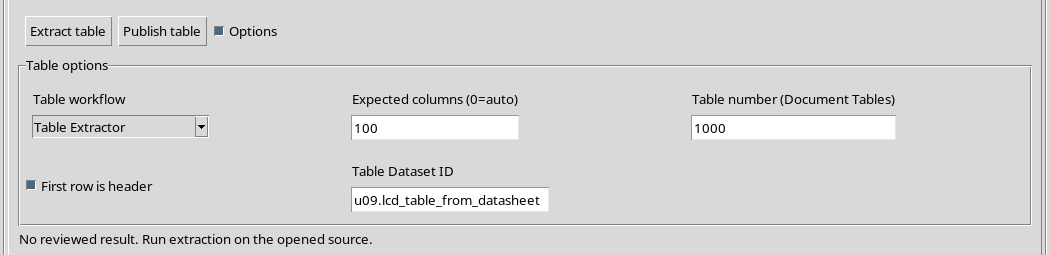
Accepting a value in the field does not imply that a PDF really contains one hundred columns or a thousand tables. The availability of candidates and the outcome of the reconstruction remain to be assessed on a case-by-case basis.
25. What protects validation
The control prevents the worker from starting with Expected columns and Table number outside the expected ranges. It can therefore block incorrect inputs before an operation is performed.
The formal validity of the input does not certify the accuracy of a scientific result: a table extracted with valid parameters can still contain incorrect lines or values.
26. Reduce the fingerprint of the GUI
When you have finished setting parameters, turn off Options to leave more room for the Editable table (Enter / Escape) grid. The panel can be reopened without abandoning the tab.
There is no need to leave all the application settings open at the same time when reviewing cells.
27. Change tab and find options
Switching to PDF / Image and returning to Tables, you can reopen Options and still find the valid parameters set in the current window.
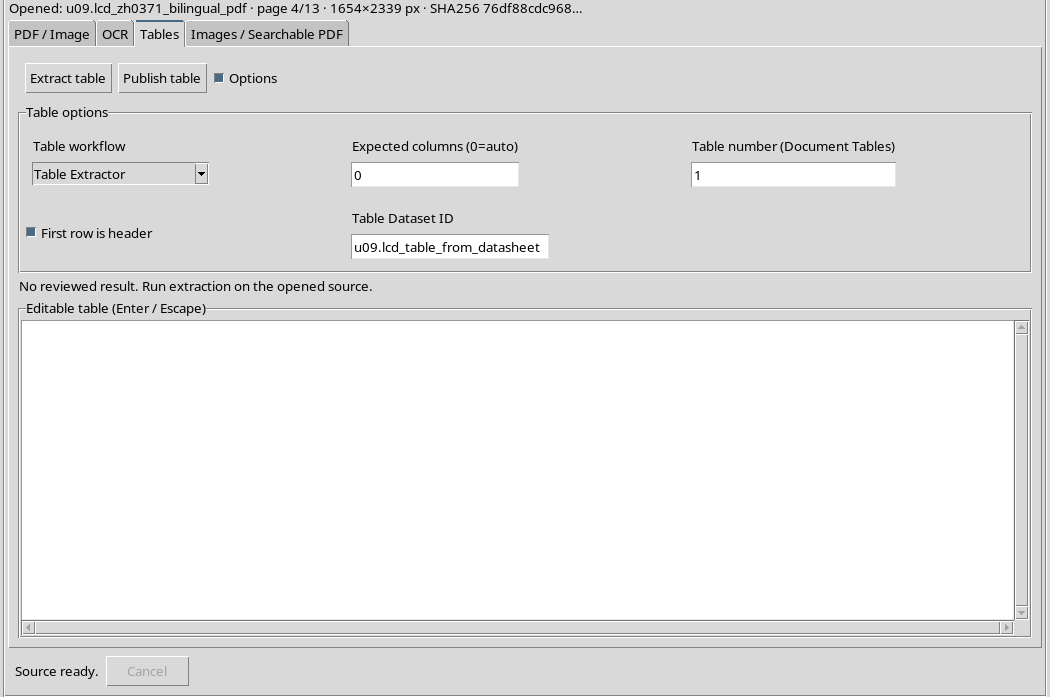
In the example the grid remains empty and the Session contains only the initial PDF Dataset: we haven’t pressed either Extract table or Publish table yet.
28. The next step: extract and verify a real table
The options are ready for a concrete test. In the next chapter we will use the English/Chinese datasheet to run Extract table, observe Editable table, compare reconstructed cells with original ones and document the limits of the method.
Only after the values are compared will it make sense to talk about any changes to the cells and the subsequent publication as Tabular Dataset. The result should not be anticipated based on the settings only.