Running and results
Options shared by the providers
- Data selection (optional X interval)
- Leave the field empty to use all rows. To restrict the analysis, enter the ID of a Dataset Selection already registered in the Session, of the X-interval type and compatible with the same source. The ID refers to the Selection object, so typing two bounds directly into the field causes a rejection. The statistics apply the selection before handling missing data. In a Session with a test selection on values 1–6 of
sample_id,sel_001the descriptive analysis ofvoltageis reduced to 6 values with a mean of 10 V. The IDs are assigned by the Session in which you create the selection. - NaN / Inf and missing group policy
omitexcludes non-finite values from the estimate according to the method.errorstops the run if there is an invalid value. In ANOVA the policy also covers the group. In Grouped Statistics the group has its own selector. In PCA you find Missing-pair policy instead. Compare the initial, valid and excluded counts in the report.- Pairwise results Dataset ID
- For methods with one main output Dataset, type a free ID. The label is shared, even though the result can have one row per metric, group or test. Use the ID given in each exercise to find the Dataset again.
- Output Dataset ID prefix
- Enter a free base name for multiple results. The provider adds the suffixes given in the chapter. If one of the IDs already exists and belongs to another source or publishing authority, choose a new prefix. Keep different IDs when you want to compare two runs.
- Create group-mean graph
- Where available, the checkbox requests the provider-specific plots. You can clear it to calculate and publish the tables without automatic rendering. The plots belong to the Plots areas and to the analysis variants in the main window. The chapters state which plot each method produces.
Running a single method
- Choose the provider, the source and the required columns, then assign an output ID or prefix. If you want to keep the recipe, save it now from Workspace.
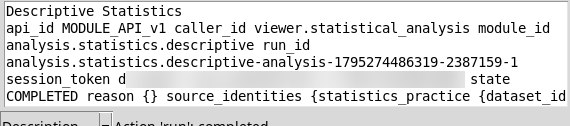
- Press Run selected method. The text area at the bottom shows the invoked ID and the state
RUNNING. The operation uses the standard analysis queue of the GX-TXT process. The checkboxes already set on the Run page of the main window stay independent. Installed and compatible providers can be invoked from the viewer even if they are disabled for the normal path in Analysis. - Wait for the entry
state COMPLETEDin the report. The lineAction 'run': completedmeans that the viewer command has processed the request. For the scientific result, check the receipt state anyway. If another analysis is using the queue, wait for it to finish before sending a second request.
Checking interruptions and rejections
- Missing parameters or source
- The request can be rejected before it starts. For example, without a Dataset the status line reports that the source
primaryhas no ID. Some menus offer choices that belong to other providers. The messageChoose one of: …shows the valid subset for the request. Correct the field and run again. - FAILED
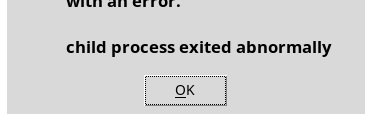
- The calculation had started and then stopped. The window can show
Targeted analysis: module finished with an errorand a generic reason. Confirm with OK, then read the log in the Run tab of the main window to locate the cause. Reproducible cases include NaN witherror, bin edges that do not increase and IDs that the provider cannot use. - Cancel and CANCELLED
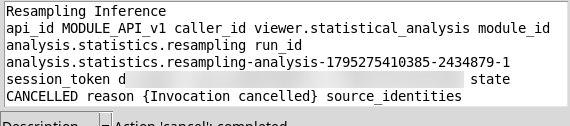
- Press Cancel while the receipt shows
RUNNING. The command concerns the viewer invocation. Wait forCANCELLED. If the calculation has already finished, the button stays available but cannot cancel a result that has already been published. After it stops, check the Session Datasets before running again with the same prefix. - INTERRUPTED
- The receipt belongs to a process that no longer owns the run. A rerun starts from a recipe and from sources available in the Session. After a restart this viewer starts again from the configuration, and the previous receipt stays in the Session. Open a Workspace saved before the analysis, or set the method and the data again. Check the inventory of publications first.

Finding tables, reports and plots
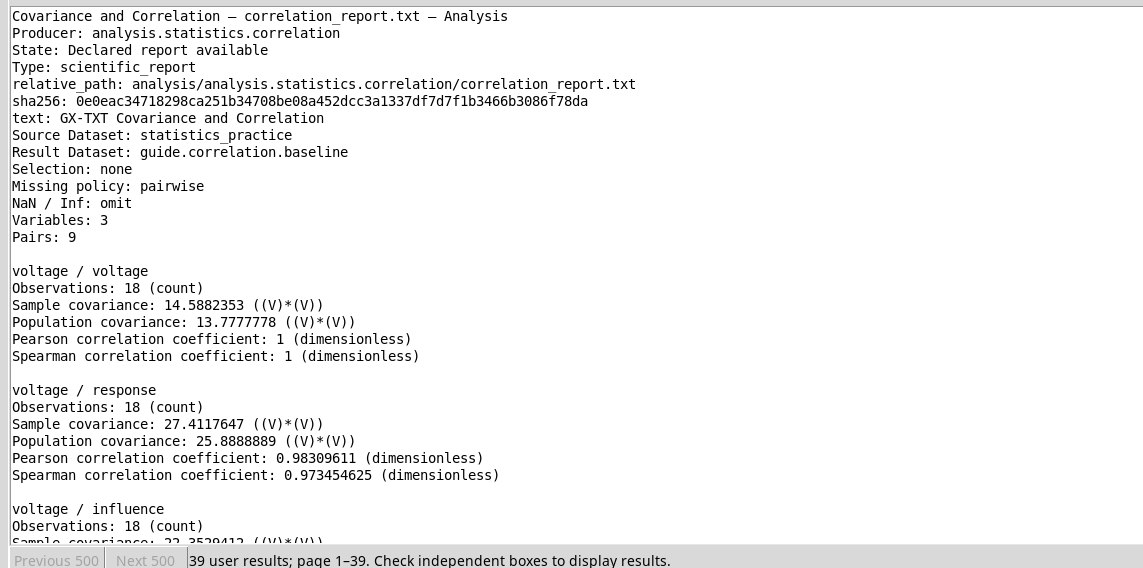
Inspect publications replaces the text at the bottom with the inventory of the results recognised in the Session. You can also use it before running, to see which data are already there. To look at an item with enough space, go back to the main window and open Results.
- Search for the name of the report or of the Dataset. For example, type
descriptive_statistics_report.txt. Keep All or use the Analysis. - Tick the checkbox to the left of the item to read the details and the text at the bottom. Check displayed group ticks the filtered rows, Clear all clears the ticks and Copy checked results copies the readable details.
- For Datasets, select a row and use Open focused result to open the Dataset viewer, then select Canonical table to read the rows. You read a report by ticking its row. Use Refresh if the list predates the last run.
The declared reports refer to the last run of that provider in the output folder. Keep a copy of the report when you need to compare it with a later one. Tables with distinct IDs can be reused as canonical Datasets. A numeric output can exist independently of the plots. To view the variants requested by the providers, select the plot in Plots or in the analysis tab that manages it.
Changing the provider settings
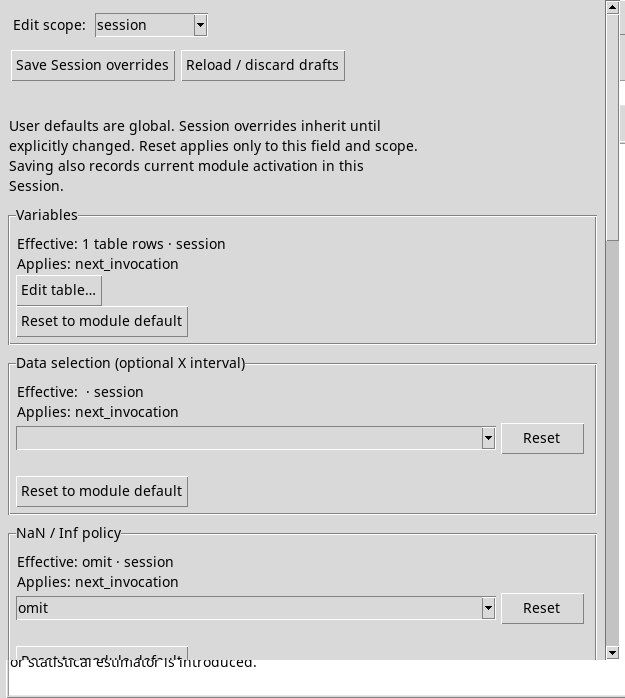
With a method selected, press Expert settings. It opens Settings — … for that provider. The window shows the effective value and when it is applied. Choose Edit scope user for the available user settings or session for the Session changes. Available scopes shows the fields you can edit only at a given level. If the Session scope inherits the value, setting an override acts on that Session.
Scroll through the fields, change the supported ones and check the effective value. Reset in the window concerns the selected field and scope. Reset to module default restores the module value. Use Save Session overrides to confirm the Session values and Reload / discard drafts to reload the saved values and discard the changes in the window. Before running from the viewer, check again the values already filled in the panel. The run uses the configuration you send from that viewer window.
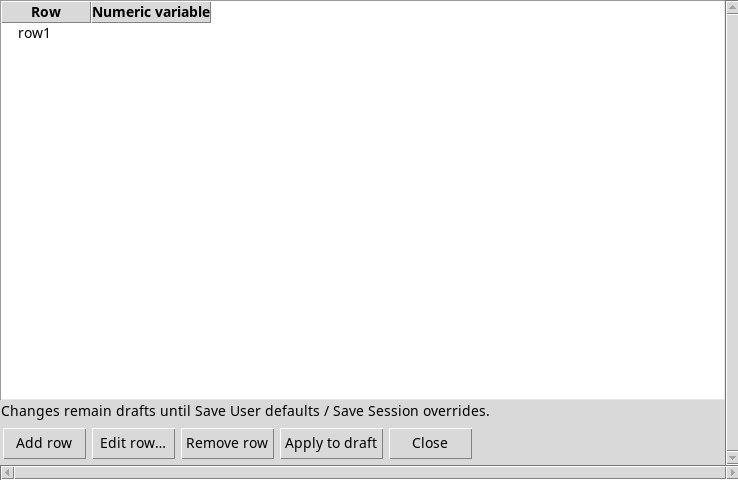
For Edit table… of the repeatable lists, Add row adds a row, Edit row… opens its fields and Remove row removes the selected row. In Numeric variable choose a numeric column of the Dataset configured for the provider in Analysis, then Apply. If the selector is empty, configure the provider source or type the IDs directly in the viewer panel. Apply to draft transfers the table to the draft. Close closes the editor. Confirm with Save Session overrides to make the change effective.