

The 2D21 Thyratron: From Historical Curves to SPICE Models
3. What the GE and Sylvania datasheets measured
The starting source is the manufacturer’s data sheet. Before digitizing a trace you need to note axes and units, the family variable, the test circuit and the pin conditions. The two historical editions are valuable because they show several regimes for the same tube type, but they come from different manufacturers and may represent different sample populations.
| Document | Trace | Reading |
|---|---|---|
| Sylvania, p. 2 | Average Control Characteristics | Critical G1 voltage versus DC anode voltage, with several values of G2. Heater at 6.3 V and Rg = 1 MΩ. |
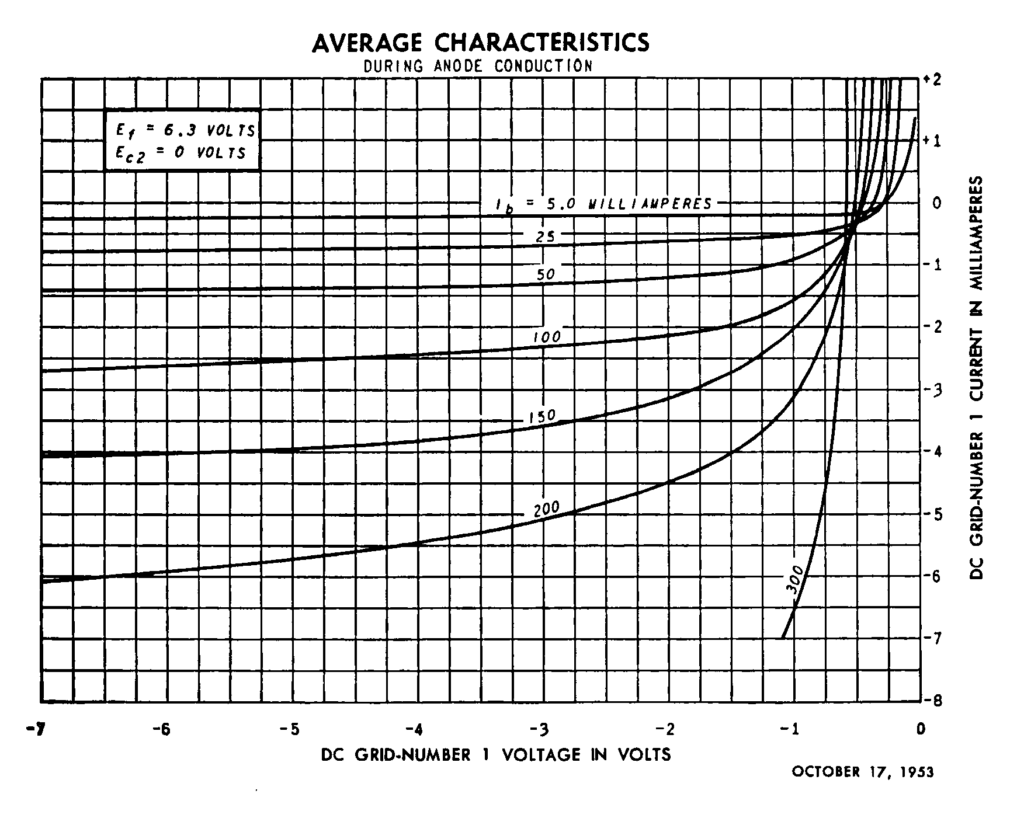
| Sylvania, p. 3 | During Anode Conduction | Ig1 in mA versus Vg1, with Ia from 25 to 300 mA and G2 at 0 V. |
| Sylvania, p. 4 | Operational Range of Critical Grid Voltage | Operating bands with the anode on 60 Hz AC, G2 at 0 V and Rg equal to 0.1 or 10 MΩ. |
| Sylvania, p. 5 | Before Anode Conduction | Ig1 in µA, with a DC anode voltage of 25, 200, 400 or 600 V and G2 at 0 V. |
| General Electric, 2D21 data sheet | Control and grid families | The conduction plate published by Giux-Lab also includes the 5 mA characteristic. |
Before the discharge: nanoamperes and drive impedance
On p. 5 of Sylvania the scale is of the order of hundredths of a microampere, while the conduction graph is in milliamperes. A current of 0.02 µA through a resistance of 1 MΩ corresponds to 20 mV. For a Thévenin equivalent source the balance is \(V_s=V_{g1}+R_g I_{g1}\), taking for \(I_{g1}\) the sign of the current entering the grid. A negative current reverses the direction of the correction compared with a positive current. If the local characteristic shows negative differential resistance, the load line can also change the behavior of the operating point. Sylvania, p. 5 · French, 1936.
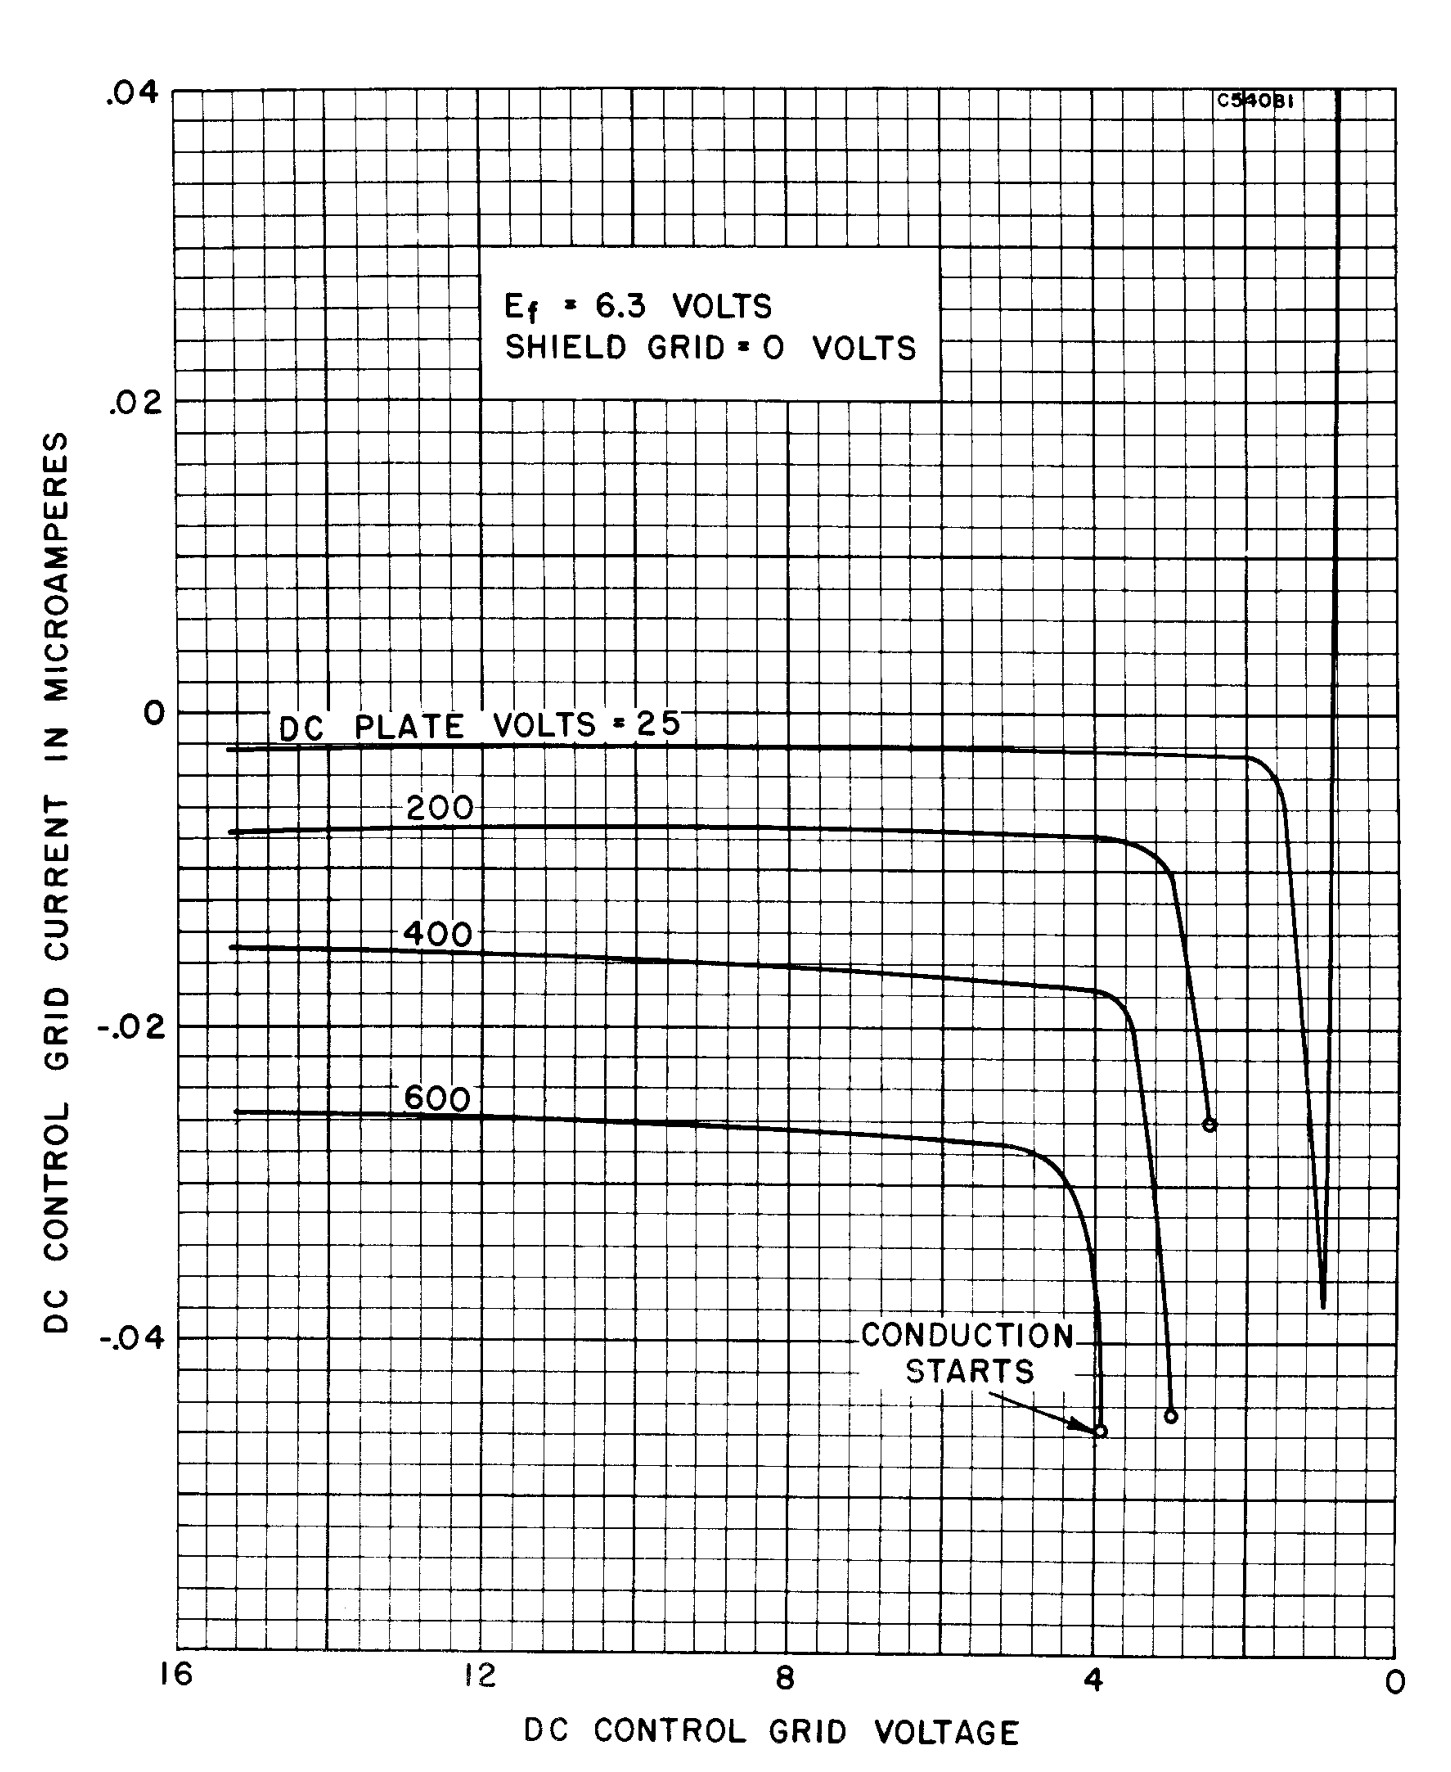
Following the curve marked 600 V from the side of large bias towards the firing end, you first meet an almost flat segment around −0.026 µA, then a knee and finally the symbol that closes the curve. For 25 V the initial segment stays much closer to zero. These are approximate readings from the grid of the print. The sharp drop ends when the state of the device changes: extending it through the firing point would produce a current that this test did not measure.
Conduction: reading the family as a set of sections
Each curve fixes an anode current and shows how the grid current varies. Towards more negative grid voltages a flattening region appears. Close to zero current the families bend and change sign. The other zero, that of the voltage with respect to K, is a distinct electrical reference. A single value of grid current after firing reproduces neither the change of sign nor the trend with anode current.
The GE 5 mA curve deserves to be identified explicitly: in the work already published on Giux-Lab, normalization with respect to Ia leaves it further from the main group, especially on the positive branch. The 300 mA family also has a narrower useful domain for some parameters. The work on the GE curves, with the consensus data and the uncertainties documents both observations.