

The 2D21 Thyratron: From Historical Curves to SPICE Models
4. The critical characteristic and grid current before firing
1929–1936: from the controlled arc to the load line
In 1929 Hull and Langmuir described how the grid could govern the start of an arc. In 1931 Nottingham published DC and AC characterizations, including the GE mercury-vapour types FG-17, FG-27 and FG-67. His measurements link the critical potential to the actual circuit conditions and already include control tests with a photoelectric cell. It is a historical precedent for the problem of the interface between sensor and grid. The measured curves belong to the tubes and test circuits described, decades before the work on the 2D21 for the Flash-Matic. Hull and Langmuir, 1929 · Nottingham, 1931, MIT scan.
French took up the problem in 1936 on the FG-17 and on the FG-95 and FG-98 tetrodes. The result documented in the abstract is that the current needed for firing depends both on the shape of the grid characteristic before firing and on the constants of the external circuit. On the FG-98 the author reports anomalies at low anode voltage with a positive shield. The reference is important for the firing criterion and the load line. The full text has yet to be checked in order to reconstruct the exact equations and experimental conditions. French, Journal of the Franklin Institute 221, 83–102.
The control ratio as a local description
For a gas triode the boundary can be expressed locally as \(V_a+\mu V_g\simeq C\), from which \(\partial V_{g,\mathrm{crit}}/\partial V_a\simeq-1/\mu\). This relation approximates a segment of the curve around a test condition. In the tetrode one must at least observe how intercept and slope change as G2 varies: even a description of the form \(V_{g1,\mathrm{crit}}\simeq a(V_{g2})+b(V_{g2})V_a\) must be checked locally, especially near the knees of the curves. Wittenberg, Gas Tube Design · Sylvania, average control characteristics.
G2 and Rg change two aspects of the measurement
Sylvania’s average DC curves keep Rg at 1 MΩ and vary G2. The AC bands on page 4 instead keep G2 at 0 V and show two values of Rg, 0.1 and 10 MΩ, including the spread stated by the manufacturer and the drift over the life of the tube. The grid voltage at the terminals and the supply voltage of the network can differ by the drop across Rg. To compare GE and Sylvania it is also necessary to check which of these quantities is printed on the axis and whether the anode voltage is DC or expressed as an RMS AC value. Sylvania, operating range of critical grid voltage · GE, control curves.
For the EN91, the 1954 Mullard handbook places the variation of the control characteristic with the shield alongside the grid-current curves before and during conduction. It is direct evidence of how manufacturers organized their data. A numerical comparison between publications requires aligning sign convention, heating, shield condition and source resistance. Mullard, Thyratrons for Industrial Control, p. 43, graphs 117–119.
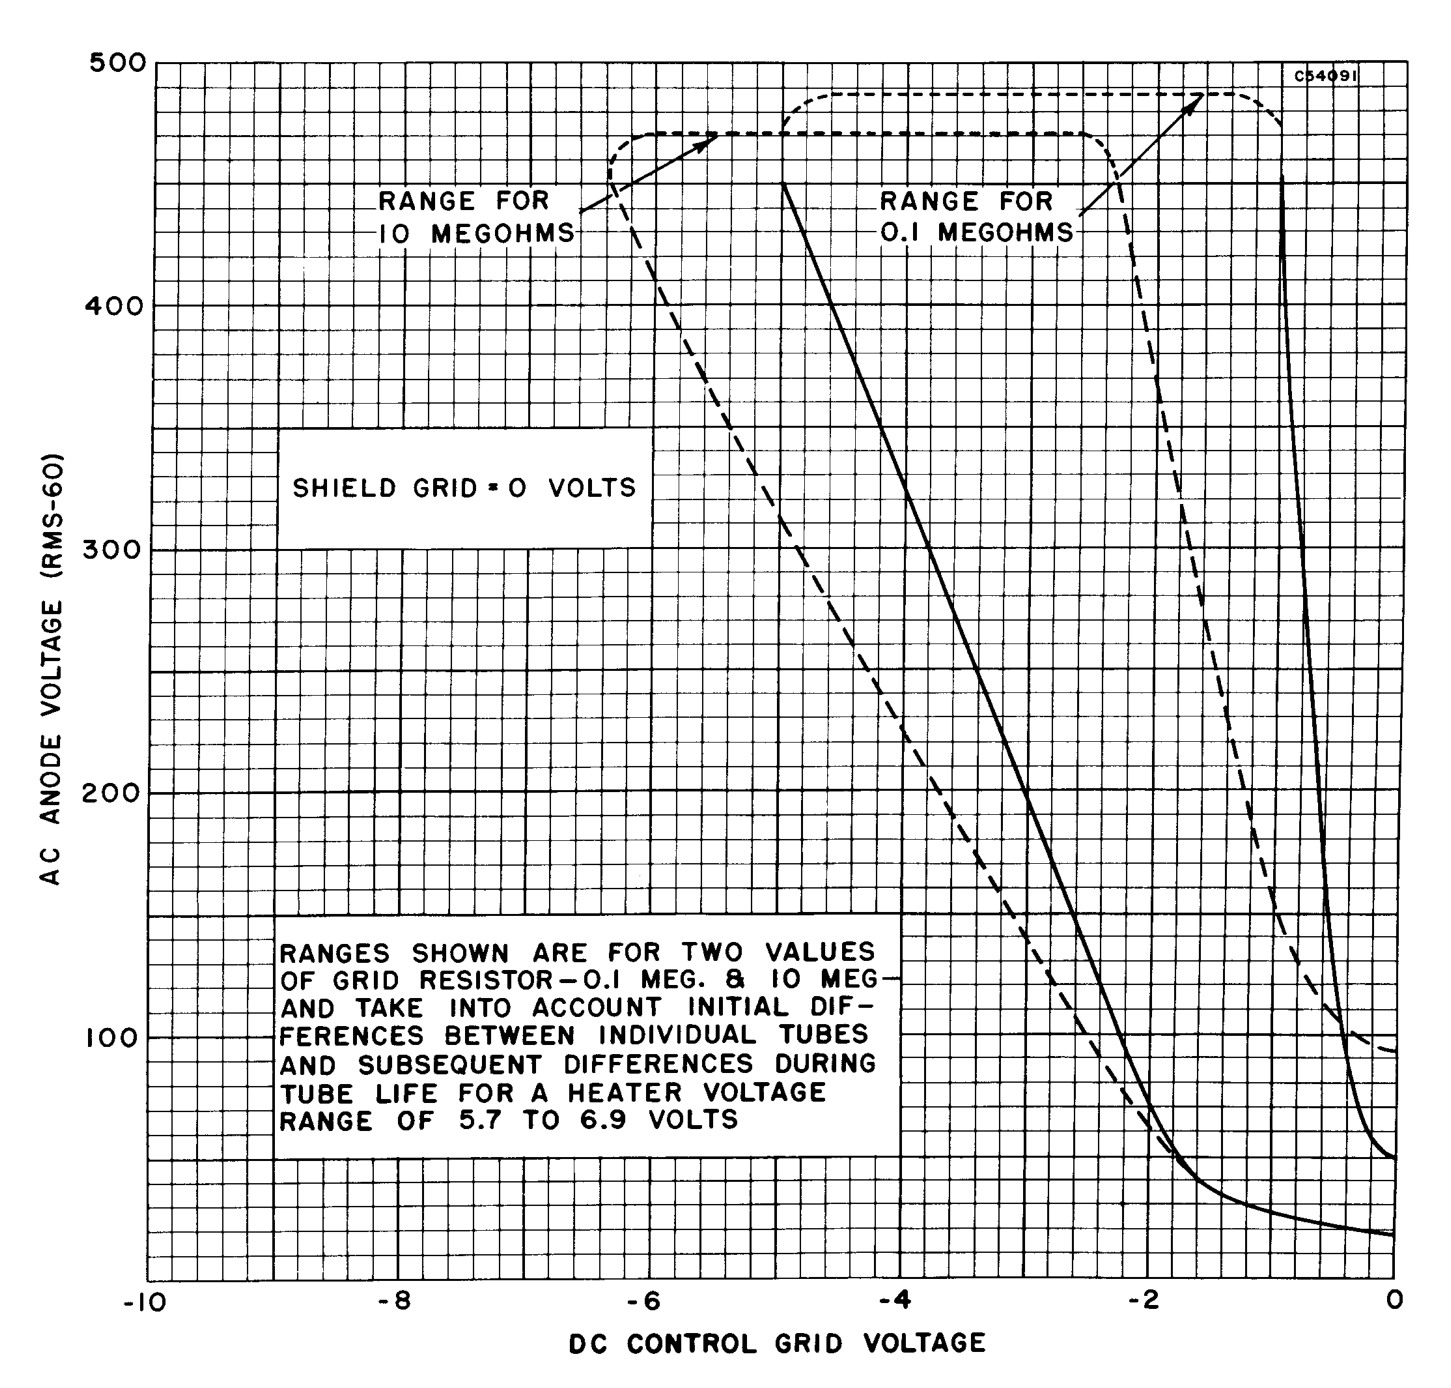
In the AC plate, a horizontal section at a fixed anode voltage intercepts the limits of each band. The width includes the initial differences between tubes and those that arise during their working life. Sylvania also includes the variation of the heater voltage from 5.7 to 6.9 V. Using the center of the band as a single experimental value would lose this information and attribute to the instrument a precision absent from the document.
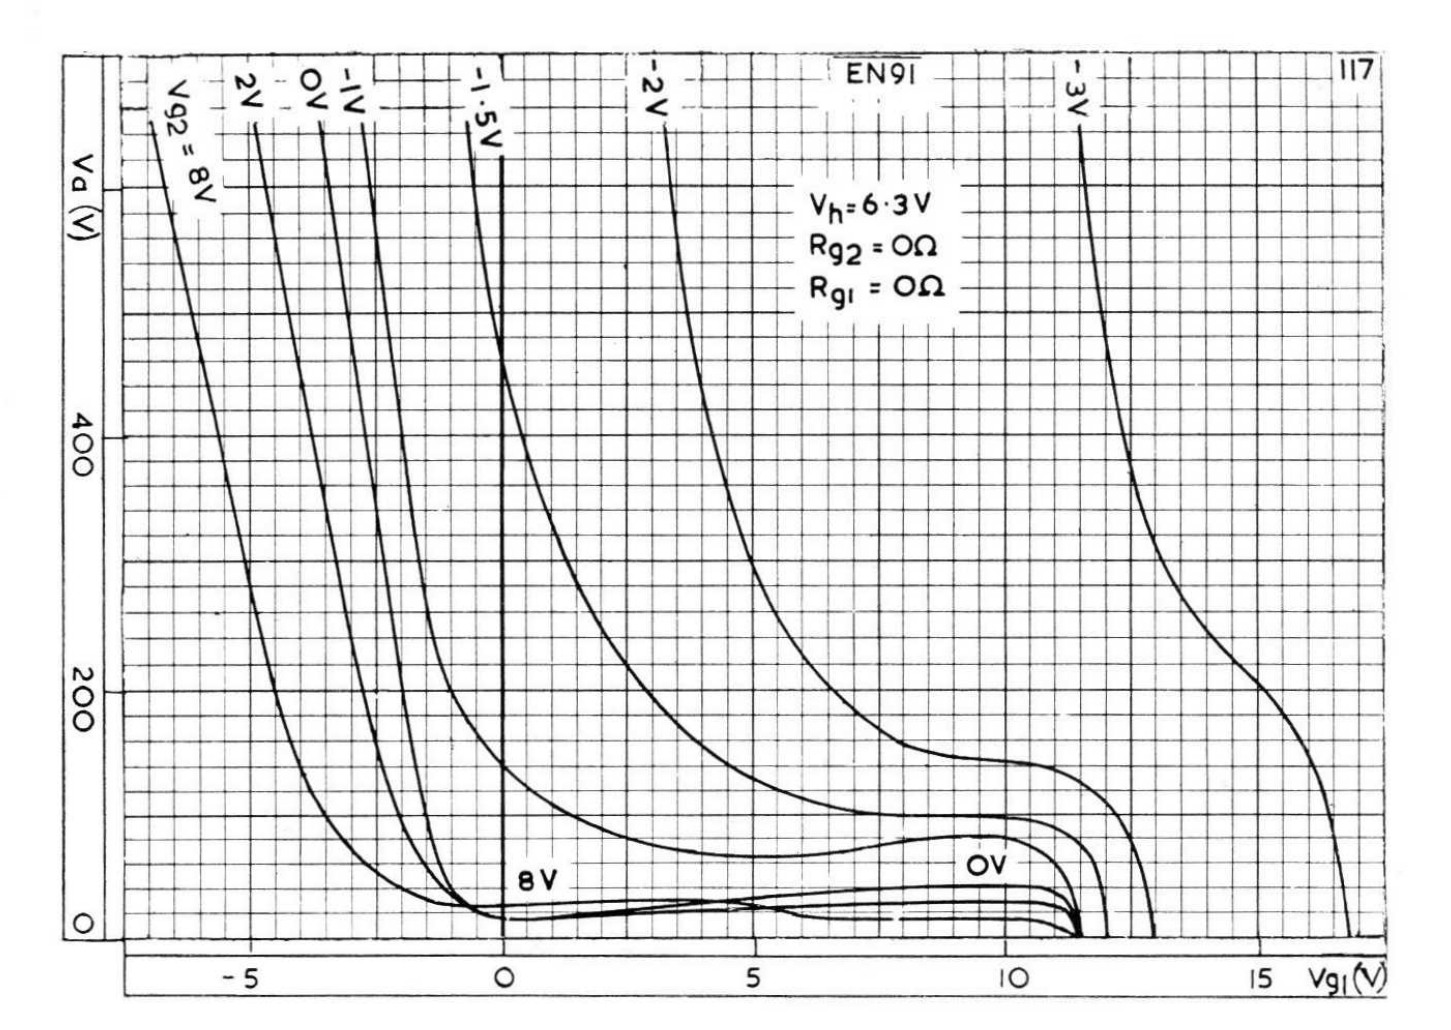
In plate 117 Mullard keeps the heater at 6.3 V and sets the G1 and G2 resistances to zero. The labels on the lines give the shield potential. Plate 118, just below on the same page, moves on to the G1 current before firing and marks the end of each curve. In 119 the family variable changes again and becomes the anode current during the discharge. Reading the three graphs in sequence avoids attributing to a change in G2 an effect produced by a different arc current.
What an average firing curve really says
A family of curves measured at several shield voltages can be read in two directions. At fixed \(V_a\), the vertical gap between the curves gives the change in the G1 threshold as G2 varies. At fixed \(V_{g2}\), the tangent gives the sensitivity with respect to the anode. Near a knee both readings depend on the operating point: interpolating in G2 over a smooth segment is a different problem from extrapolating outside the measured domain. Sylvania’s operating-range band then adds information on the spread, keeping the conditions of the AC test explicit. Average DC curve · AC operating bands.