

Menus, Keyboard Shortcuts, Help and Viewer Settings
Chapter V03 · Illustrated Guide
This guide walks through the menus and preferences of Curve Digitalizer.
1. Purpose of This Chapter
V03 documents the window frame, the seven main menus, the keyboard shortcuts actually registered, the built-in guide and the six pages of Viewer settings. The example uses a synthetic Session and an Image Dataset image.raster, linked to a configuration named V03 Interface Audit.
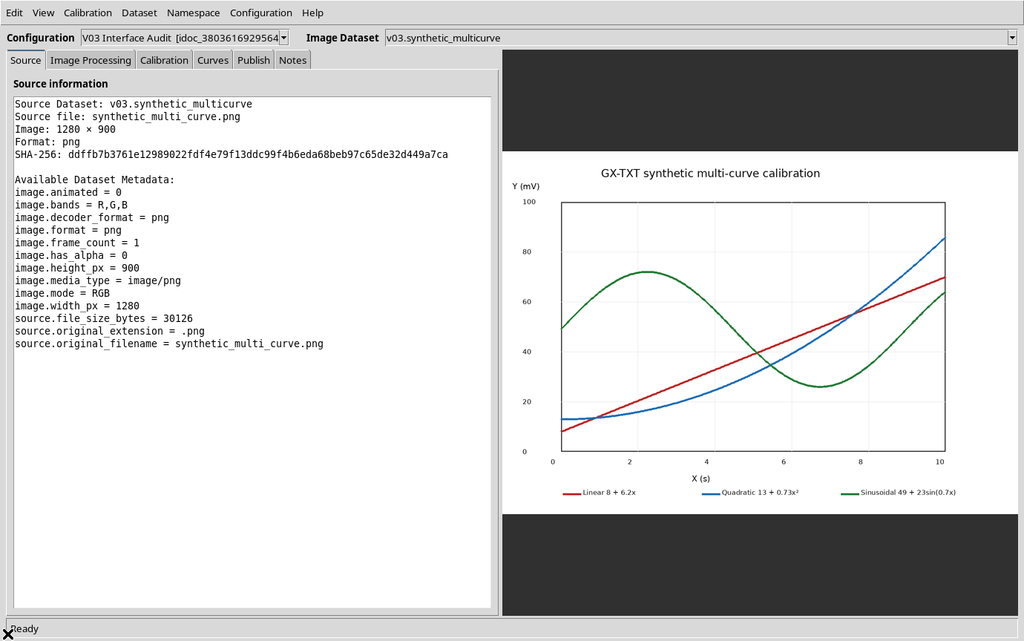
The colored graph on the canvas is the source image: it is neither a Dataset of already digitized curves nor the scientific Dataset Preview. Calibration, proposals and publishing are not shown here.
2. Window Frame, Selectors and Panels
At the top are seven menus and the Configuration and Image Dataset selectors. The first identifies the current scientific Workspace; the second indicates the canonical source. The two objects are not interchangeable.
The left side offers the Source, Image Processing, Calibration, Curves, Publish and Notes tabs; the raster canvas is on the right and the status bar at the bottom. The initial window has no standalone icon toolbar: the menus, the two selectors and the tab commands make up the main navigation system.
3. The Seven Menus
| Menu | Scope |
|---|---|
Edit | Undo/Redo, creating and editing curves and points |
View | Image fitting, tab switching and overlays |
Calibration | Axis and scale calibration, verification |
Dataset | Publishing and catalog refresh |
Namespace | Dataset discovery filter |
Configuration | Creating, saving, duplicating and preferences |
Help | GX-Markup manual and Viewer information |
4. Edit and View
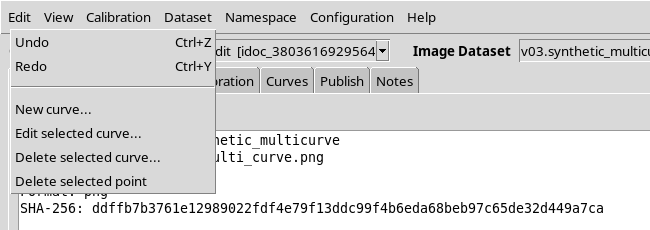
The Edit menu includes Undo (Ctrl+Z), Redo (Ctrl+Y), New curve…, Edit selected curve…, Delete selected curve… and Delete selected point.
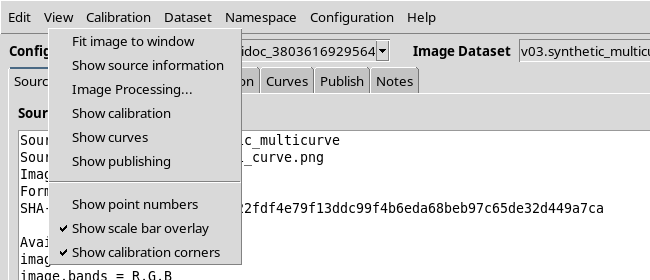
The View menu contains Fit image to window, Show source information, Image Processing…, Show calibration, Show curves and Show publishing.
The Show point numbers, Show scale bar overlay and Show calibration corners options are check items that control how elements are presented.
These last options change how markers or overlays are displayed; they must not be confused with adding new rows to a canonical Dataset.
5. Calibration and Dataset
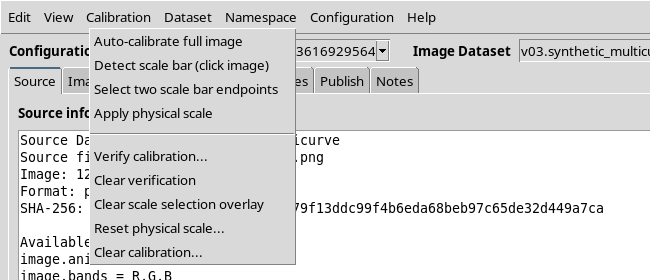
The Calibration menu exposes Auto-calibrate full image, Detect scale bar (click image), Select two scale bar endpoints, Apply physical scale, Verify calibration…, Clear verification, Clear scale selection overlay, Reset physical scale… and Clear calibration….
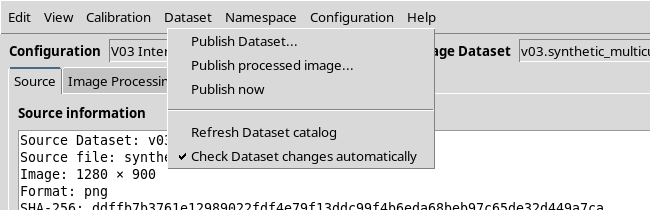
The Dataset menu shows Publish Dataset…, Publish processed image…, Publish now, Refresh Dataset catalog and Check Dataset changes automatically. The first commands lead to the publishing environment or to image processing, while the last ones concern the catalog.
6. Namespace and Configuration
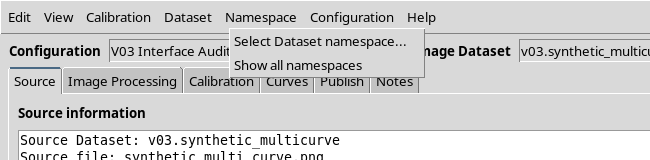
Namespace includes Select Dataset namespace… and Show all namespaces. The namespace filters the catalog of visible sources, without physically changing the location or the identity of a Dataset.
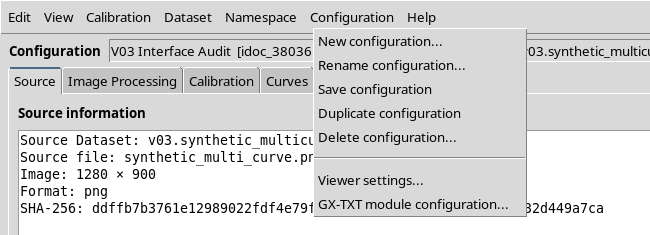
Configuration includes New configuration…, Rename configuration…, Save configuration, Duplicate configuration, Delete configuration…, Viewer settings… and GX-TXT module configuration….
The first five act on the scientific configurations persisted in the native Workspace of the framework. The last two open two different environments: the operating preferences of the Viewer and the central editor for the module defaults/overrides.
7. Help and Window Shortcuts
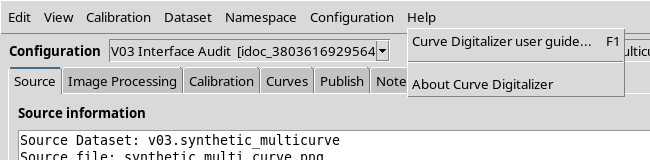
The Help menu contains Curve Digitalizer user guide…, with the F1 shortcut, and About Curve Digitalizer.
The bindings registered in the interface are:
| Key | Action |
|---|---|
Ctrl+Z | Undo |
Ctrl+Y | Redo |
Delete | Delete selected point |
F1 | Open the GX-TXT guide |
Escape | Cancel verification mode |
| Mouse wheel | Zoom/pan events on the canvas |
8. Viewer Settings: Three Levels Not to Be Confused
Open Configuration → Viewer settings…. The Curve Digitalizer — Viewer settings dialog shows the Display, Digitizing, Calibration, Axes & output, Dataset browser and Configurations tabs, with the Apply, OK and Cancel buttons always available at the bottom.
The window states that preferences are managed by the GX-TXT Configuration API v1. It is essential to distinguish between:
- User defaults: general module defaults, editable in the central GX-TXT editor.
- Session overrides: values that take precedence for the active Session;
Applycan register them through the CORE. - Digitizer Configuration: properties of the selected Workspace, such as canvas appearance, output and scientific state.
A control shown in the Viewer settings window does not imply that every parameter is written to the same scope. Changing only the overlays does not rewrite the pixels of the source image.
9. Settings → Display
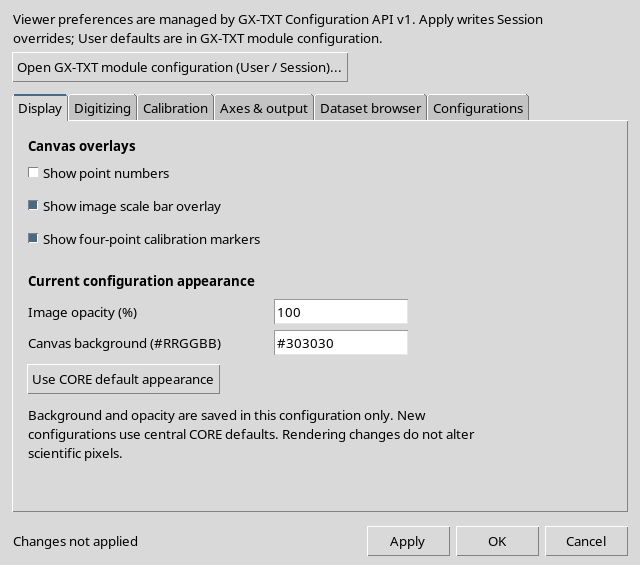
The Display tab includes Show point numbers, Show image scale bar overlay, Show four-point calibration markers, Image opacity (%), Canvas background (#RRGGBB) and Use CORE default appearance.
The first three options concern markers and overlays. Opacity and background are saved in the open configuration; new configurations instead receive the central defaults of the framework, as stated.
10. Settings → Digitizing
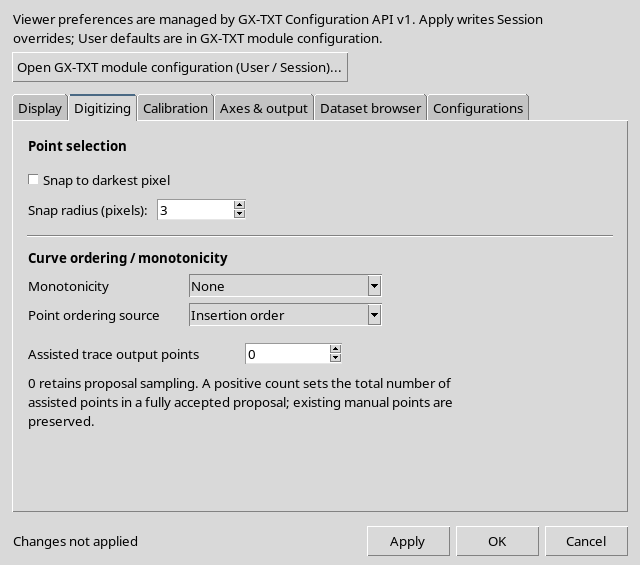
Digitizing contains Snap to darkest pixel, Snap radius (pixels), Monotonicity, Point ordering source and Assisted trace output points.
The observed values were a radius of 3 pixels, None for Monotonicity, Insertion order for ordering and 0 assisted points. The interface explains that 0 keeps the original sampling of the proposal, while a positive number sets the total number of points of a fully accepted proposal.
11. Settings → Calibration
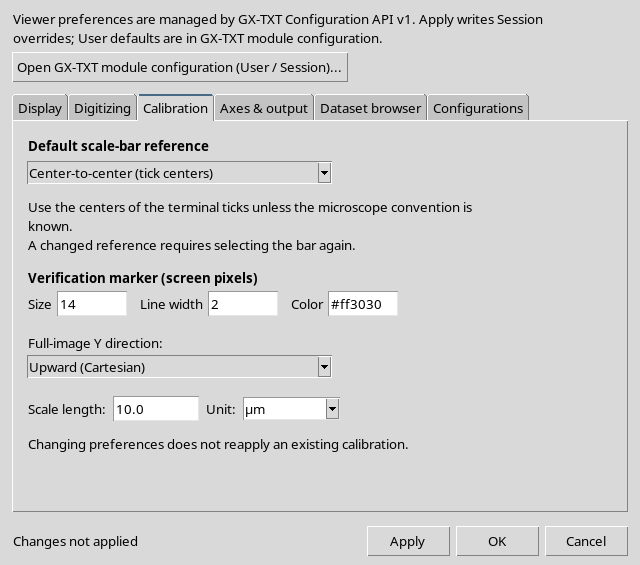
This page contains Default scale-bar reference, Verification marker (screen pixels) with Size, Line width and Color, Full-image Y direction, Scale length and Unit.
The image shows Center-to-center (tick centers), a 14-pixel marker, width 2, color #ff3030, direction Upward (Cartesian), length 10.0 and unit µm. These are the settings resolved in this guide, not values that every user should adopt.
The interface specifies that changing the preferences does not automatically reapply an existing calibration. The geometric verification of measurements is left to the calibration chapters.
12. Settings → Axes & output
The Axes & output page is scrollable. The upper part presents Scientific axes, the Enable secondary Y axis checkbox, Go to axis calibration…, Dataset ID and Display name.
The interface text clearly distinguishes the logical axes: Y1 and Y2 do not automatically mean left and right, and all curves share the four corners of the image. The second Y was disabled in this guide; the two-axis scientific configuration will be verified in V10.
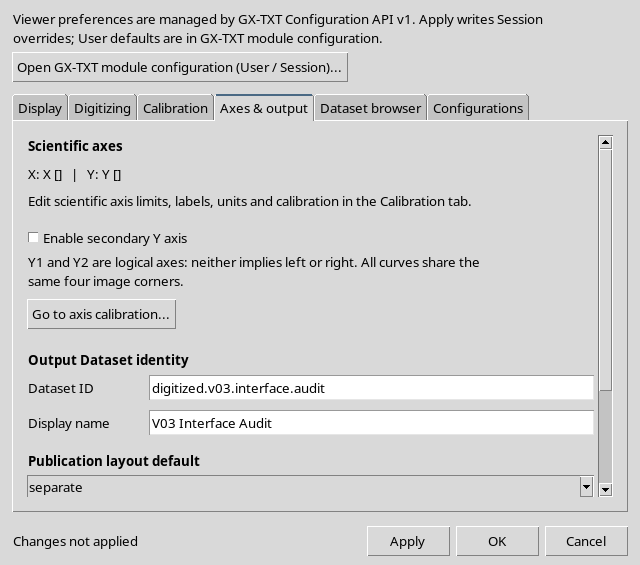
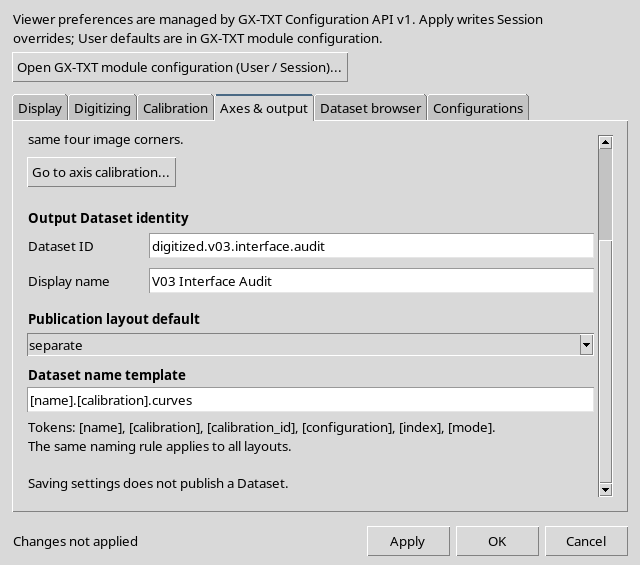
Scrolling down, Publication layout default, Dataset name template and the tokens [name], [calibration], [calibration_id], [configuration], [index], [mode] appear. The example value is separate and the template is [name].[calibration].curves.
The sentence Saving settings does not publish a Dataset means that saving the preferences does not by itself create a canonical table. Combined/Separate and their effect on the Datasets will be covered in the publishing steps.
13. Settings → Dataset browser and Configurations
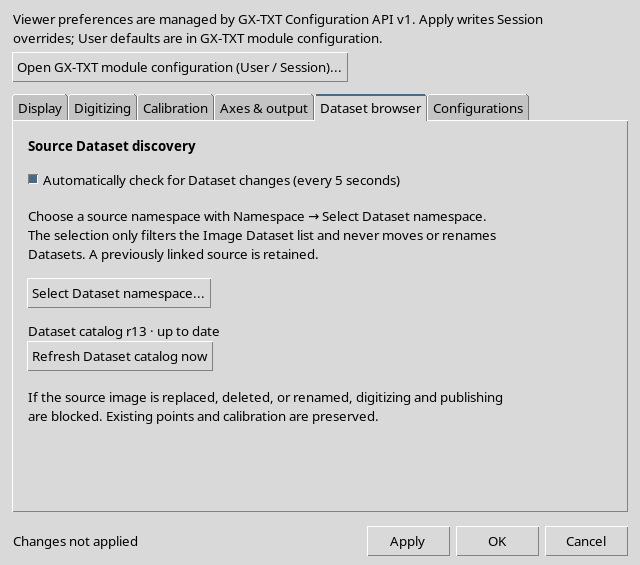
Dataset browser contains Automatically check for Dataset changes (every 5 seconds), Select Dataset namespace… and Refresh Dataset catalog now, along with the diagnostic message on the current state of the catalog.
The interface text states that the namespace filter does not move or rename Datasets, and warns that a replaced or deleted source requires safeguards against points being associated with different pixels. The errors SOURCE MISSING and STALE SOURCE can occur.
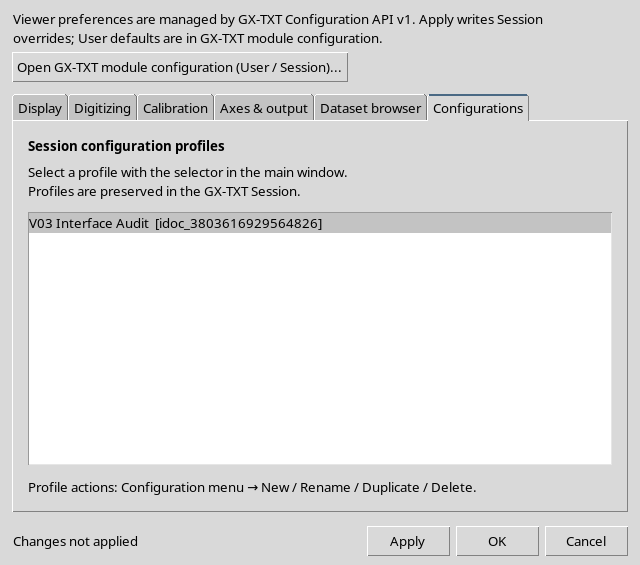
Configurations shows the Session configuration profiles and refers to the Configuration → New / Rename / Duplicate / Delete operations. It is not a second, parallel archive: the Workspaces remain those managed by the framework.
14. Apply, OK and Cancel: A Persistence Test
Cancel closes the dialog without applying the draft. Apply applies and leaves the window open. OK applies and closes.
The test was carried out on Show point numbers:
- Initial state from the CORE:
0, origin user. - Enabled in the dialog without saving: Changes not applied appeared, and the CORE remained at
0 · user. - Cancel: no change to the value resolved by the CORE.
- Reopening, enabling and Apply: Applied and saved to the selected configuration appeared; the CORE returned
1 · session. - In the same window, a second Apply after setting the checkbox back to
0: the CORE returned0 · session.
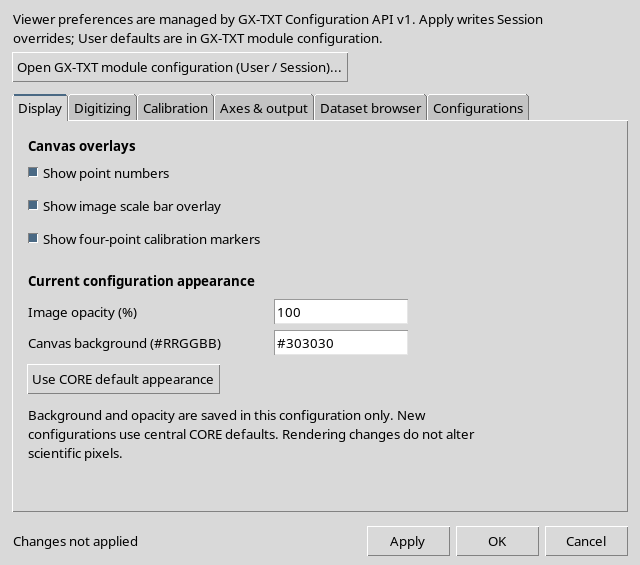
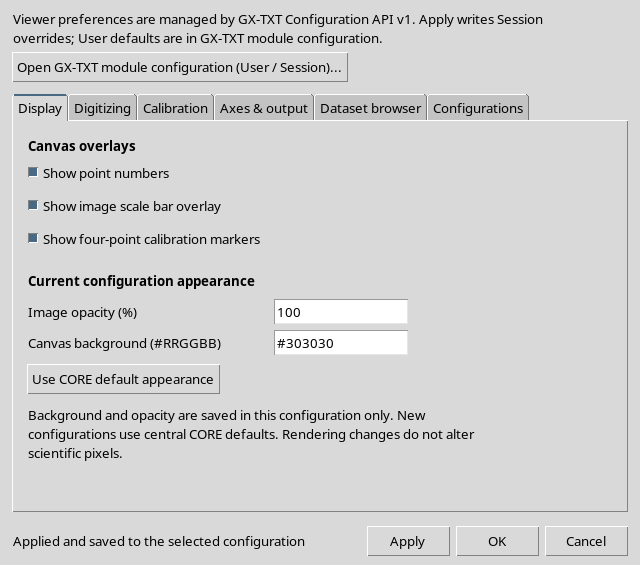
The second Apply worked using the updated CORE version. The effective value 0 was restored, but a private override with origin session remained; the origin did not automatically revert to user. This distinction must be respected when evaluating the effective preferences.
The User defaults, other Sessions and the scientific Datasets are not modified.
15. Central GX-TXT Editor: User and Session
The Configuration → GX-TXT module configuration… menu opens the actual central editor, Settings — Curve Digitalizer.
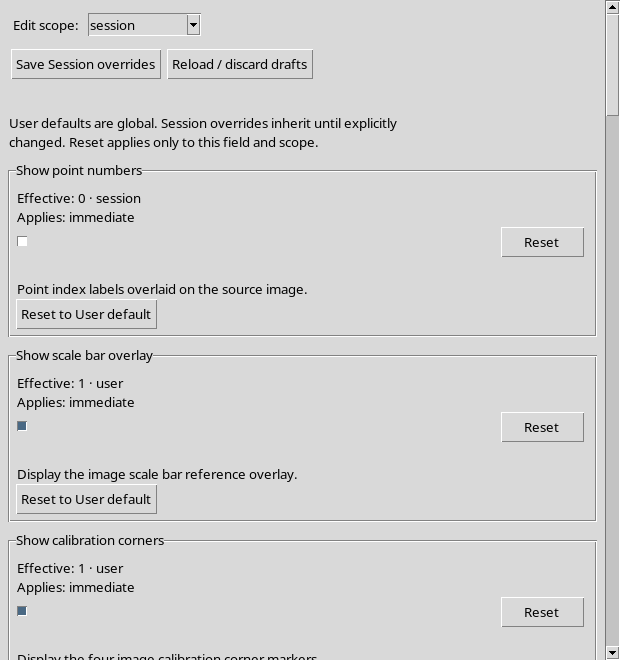
The Edit scope field offers user and session; there are Save User defaults, Reload / discard drafts and Reset buttons for the individual options. The rows show the effective value and the scope it comes from.
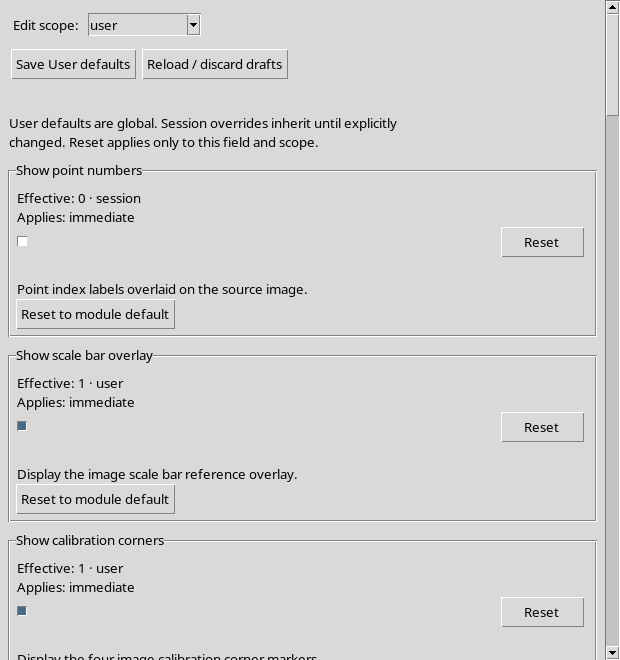
An important point: after the double Apply, the Show point numbers field reports Effective: 0 · session even with Edit scope: user selected. The effective value is resolved by the CORE according to precedence: the edit menu and the origin of the effective value are not the same thing.
The session view was also selected, without saving any new value in the central editor, and the window was then closed.
The global settings of the GX-TXT interface, including the X11 popup and tooltip preferences, belong to another framework panel: they are not Viewer settings controls.
16. GX-Markup Guide and About Window
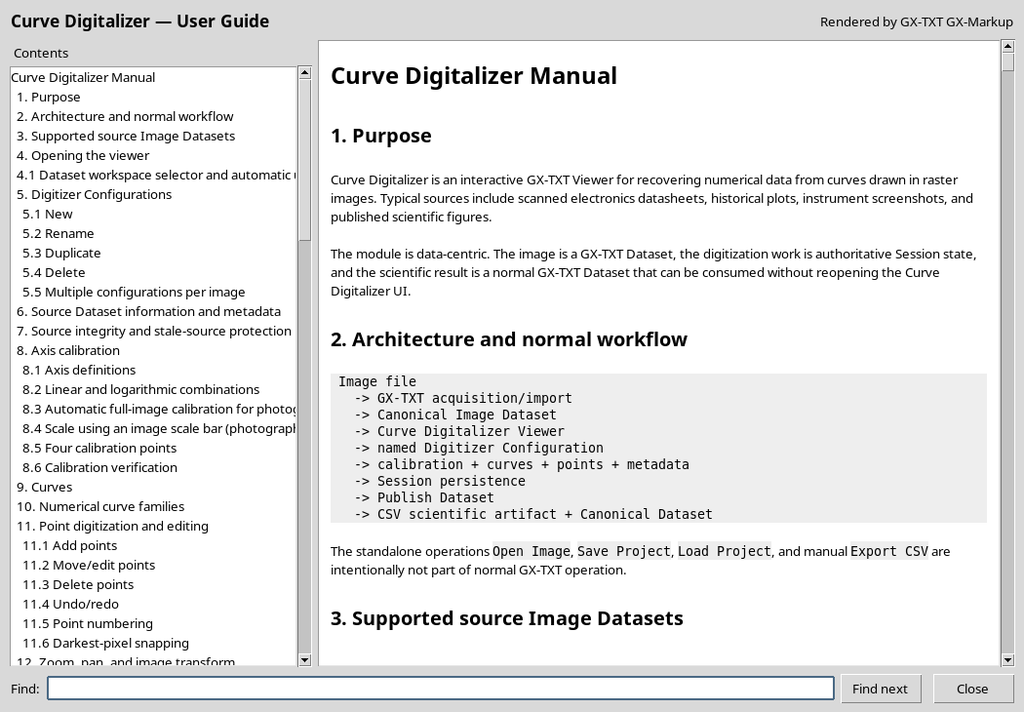
F1 or Help → Curve Digitalizer user guide… opens the Curve Digitalizer — Rendered User Guide window. The engine is the GX-TXT GX-Markup renderer: the table of contents of the manual appears on the left, the formatted scientific text on the right, and Find, Find next and Close at the bottom.
The Find next command scrolls to the next match.
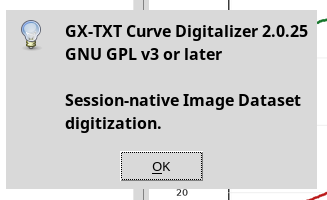
Help → About Curve Digitalizer opens a dialog that shows 2.0.25, while the actual version in this case is 2.0.26 (a minor discrepancy that will be fixed).
17. Operational Summary
For everyday use, select Configuration and Image Dataset, reach the controls from the menus and open Configuration → Viewer settings… for the operating preferences. Apply registers the changes and leaves the window open, Cancel discards the draft; for the general defaults you need GX-TXT module configuration…, always checking Edit scope and Effective.
The F1 key makes the Viewer manual available within the GX-TXT system. The scientific operations will be examined, with real canonical data, in the following chapters.