

Curve Digitalizer: User Interface Guide
This guide covers the Curve Digitalizer interface, the GX-TXT viewer for digitizing curves, and how to inspect published datasets in Dataset Preview. It comprises 34 chapters, each on a separate page: 28 on the Curve Digitalizer Viewer and 6 on Dataset Preview and Plot API v4. The same sequence appears in the Chapters column on the left.
Reference versions
- GX-TXT:
0.9.8.10-dev-112· patch005 - Curve Digitalizer Viewer:
2.0.26— theAbout Curve Digitalizerdialog still displays2.0.25, but the actual version is2.0.26 - Dataset Preview:
0.1.12 - Plot Dataset:
4.4.1
Interface
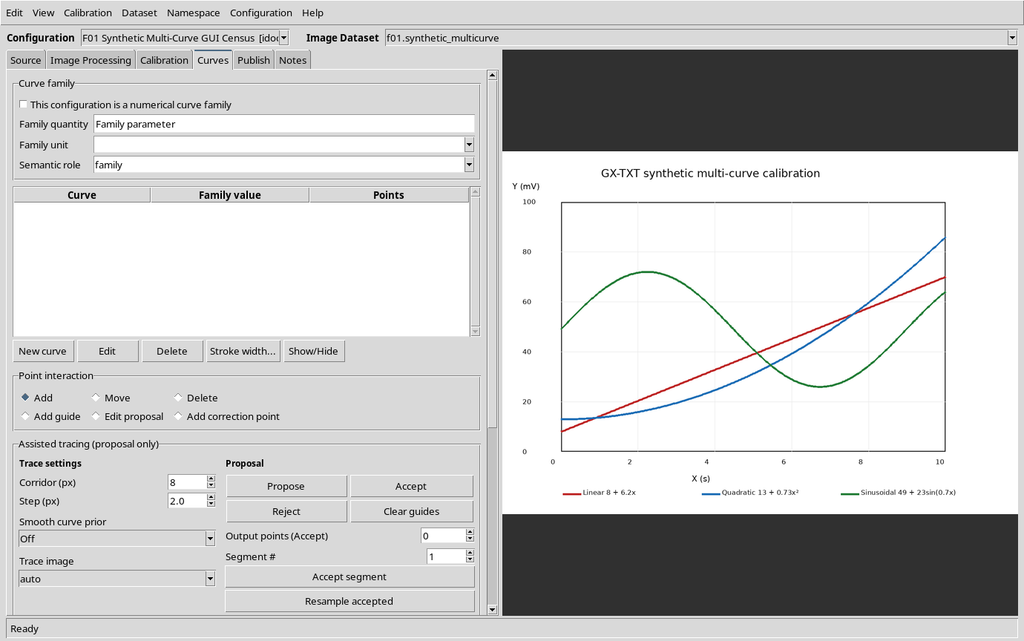
The Viewer window has six tabs. The relevant chapters are indicated alongside each one.
- Source — Canonical image, provenance, and source metadata. (ch. 1 and 4)
- Image Processing — Non-geometric filters, comparison, and processed image. (ch. 19–20)
- Calibration — Scientific axes, four-point calibration, scale bar, and verification. (ch. 6–11)
- Curves — Curves, points, and assisted tracing. (ch. 12–18)
- Publish — Canonical datasets, accepted calibration measurements, and publication layouts. (ch. 24–26)
- Notes — Configuration notes in UTF-8. (ch. 23)
Main menus
Seven menus, in the order shown on the menu bar. They are described in Chapter 3 — Menus, keyboard shortcuts, Help, and Viewer settings.
Viewer settings
Six settings pages, also described in Chapter 3.
Chapter map
Curve Digitalizer Viewer — 28 chapters
Getting started, configurations, and window layout (ch. 1–3)
- Open Curve Digitalizer and link the first image · V01
- Digitizer Configurations: create, save, and manage your work · V02
- Menus, keyboard shortcuts, Help, and Viewer settings · V03
Source image and canvas (ch. 4–5)
- Source Image Dataset, namespaces, and catalog updates · V04
- Canvas: zoom, pan, display, and overlays · V05
Scale and calibration (ch. 6–11)
- Scale bar: acquisition, tick conventions, and physical units · V06
- Four-point calibration with linear axes · V07
- Logarithmic calibration, mixed axes, and Y direction · V08
- Calibration groups and repeated measurements · V09
- Logical Y1/Y2 axes: configuration, verification, and curve assignment · V10
- Calibration verification using known points and repeated realizations · V11
Curves and points (ch. 12–14)
- Independent curves and numerical families · V12
- Manual digitization: add, select, move, and delete points · V13
- Snapping, scientific point ordering, and Undo/Redo history · V14
Assisted tracing (ch. 15–18)
- Assisted tracing: guides, corridors, and proposal review · V15
- Step, monotonicity, and guide order · V16
- Smoothness and exclusion paths · V17
- Edit, accept, and resample a proposal · V18
Image Processing (ch. 19–20)
- Configure Image Processing filters and their order · V19
- Preview, compare, and publish the processed image · V20
Quality, uncertainty, and annotations (ch. 21–23)
- Stroke width, Quality diagnostics, and scientific checks · V21
- Uncertainty declarations and physical covariance · V22
- Scientific annotations, Notes, and Viewer preferences · V23
Dataset publication (ch. 24–26)
- Publish independent curves and numerical families · V24
- Separate and Combined publication, multiple calibrations, and Dataset naming · V25
- Dual-Y publication and Dataset Groups · V26
Saving, errors, and limitations (ch. 27–28)
- Save, close, reopen, and recover the Workspace · V27
- Errors, unavailable controls, and operational limitations · V28