

Dual-Y Publishing and Dataset Groups
A scientific graph can contain several quantities dependent on the same X variable. In GX-TXT, the Curve Digitalizer lets you associate different curves with the logical axes Y1 and Y2, without confusing their identity with the left or right side of a future plot.
This guide explains how to digitize two curves, publish them when they share the same unit, separate them when they have incompatible physical units, and link the results through a Dataset Group. The example uses a synthetic teaching raster, not instrumental observations. Publishing and grouping do not constitute estimates of accuracy or uncertainty.
1. Selecting the Original Raster
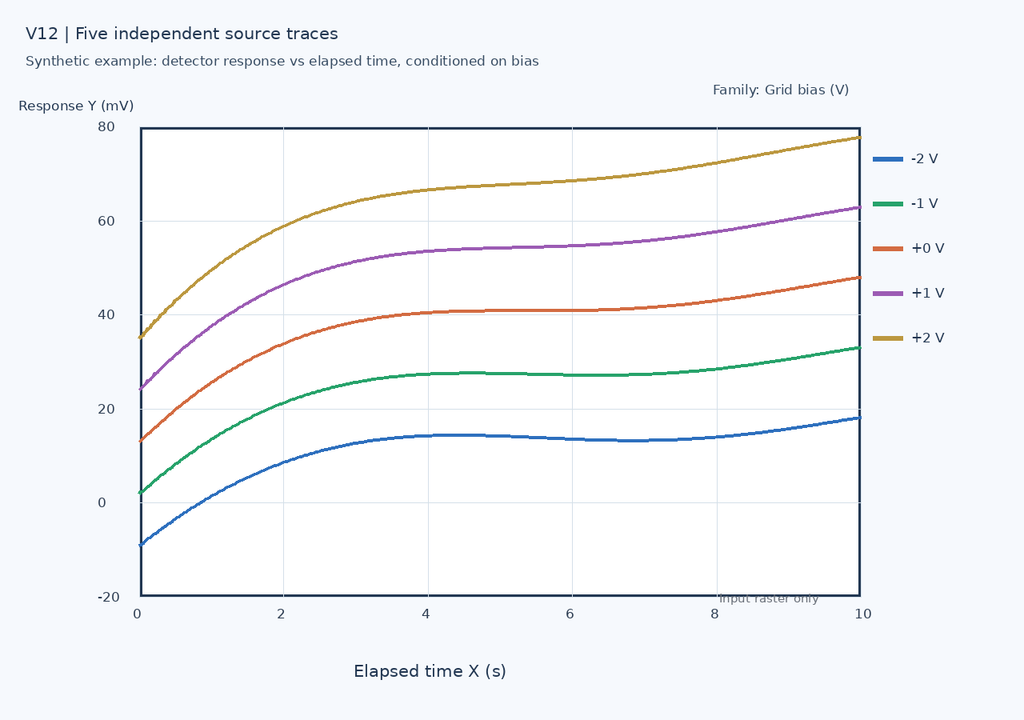
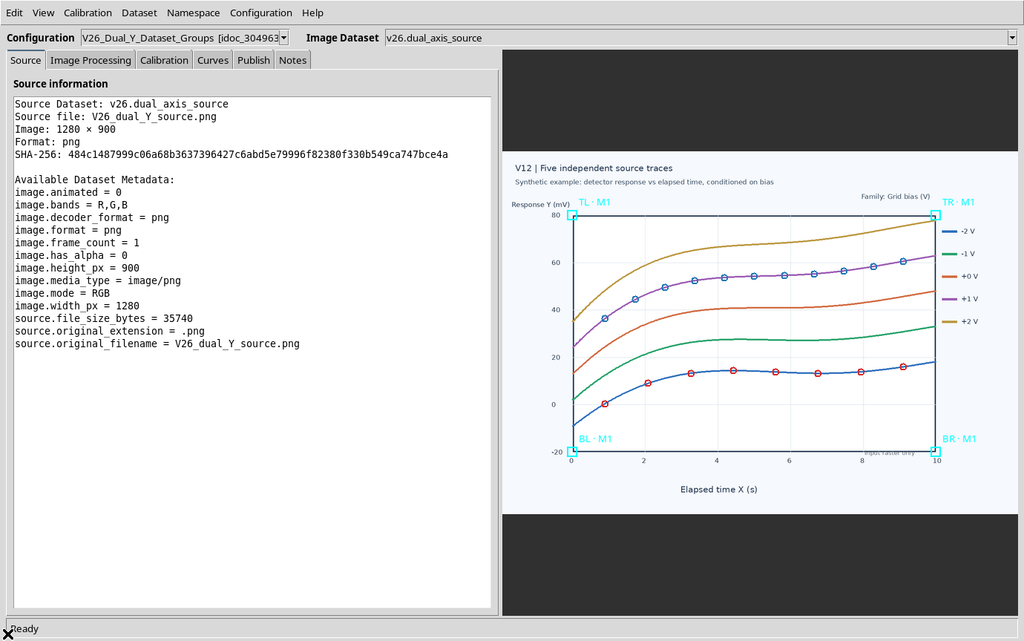
The image contains five coloured traces. We will use two traces to build two scientific curves, leaving the others as elements of the image that will not be digitized.
The source, measuring 1280 × 900 pixels, is loaded in the Source tab as the original Image Dataset.
2. Defining the Shared Geometric Calibration
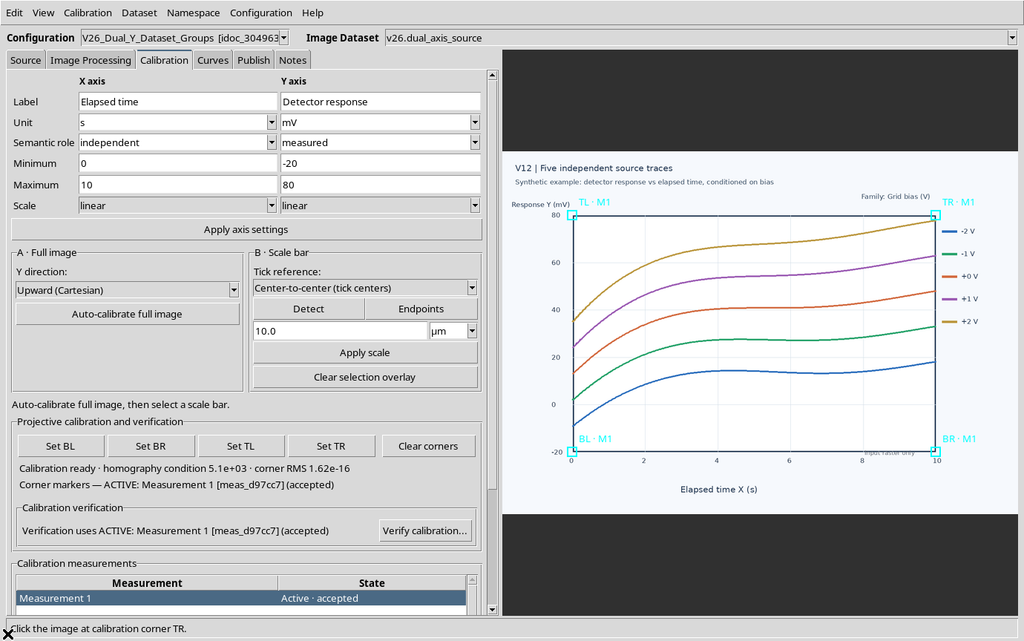
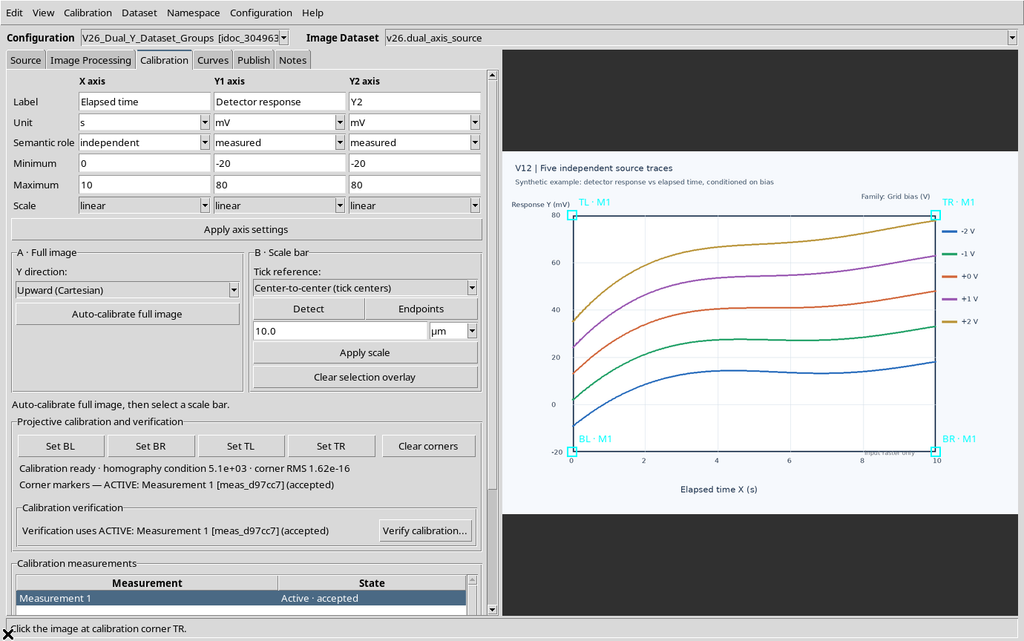
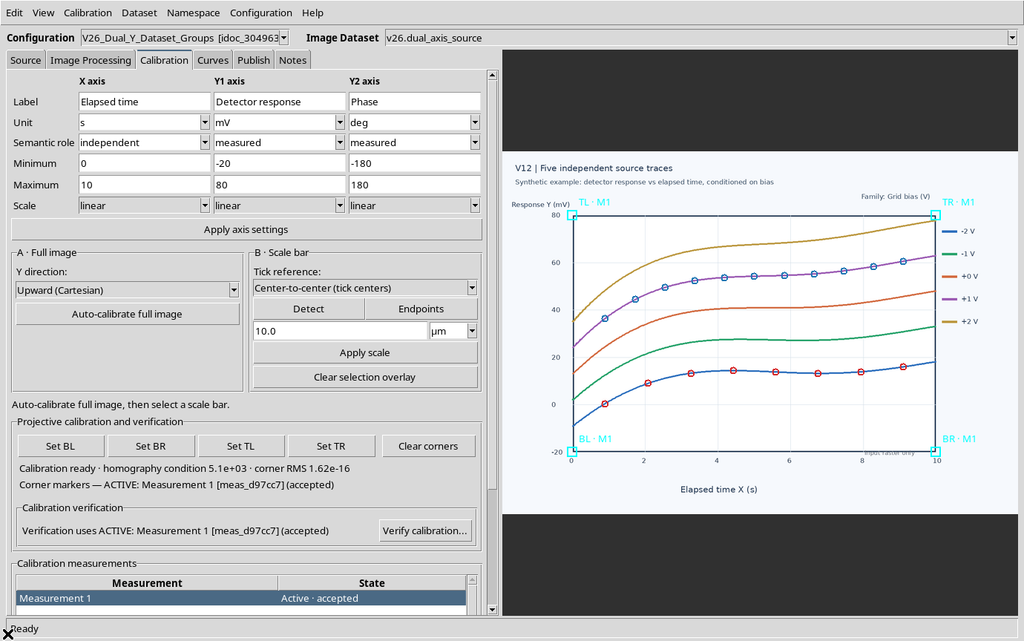
In the Calibration tab we set X from 0 to 10 s and Y1 from −20 to 80 mV. We select the four corners of the plot region and accept the calibration.
The geometric correspondence between pixels and the normalized plane remains unique for the Y1 and Y2 axes.
3. Enabling the Second Axis
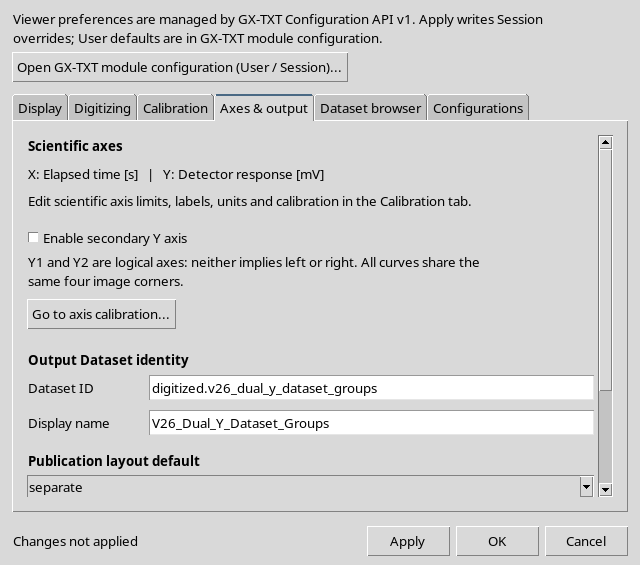
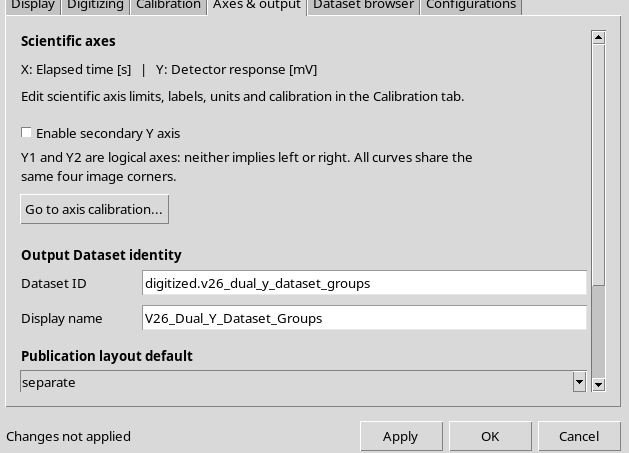
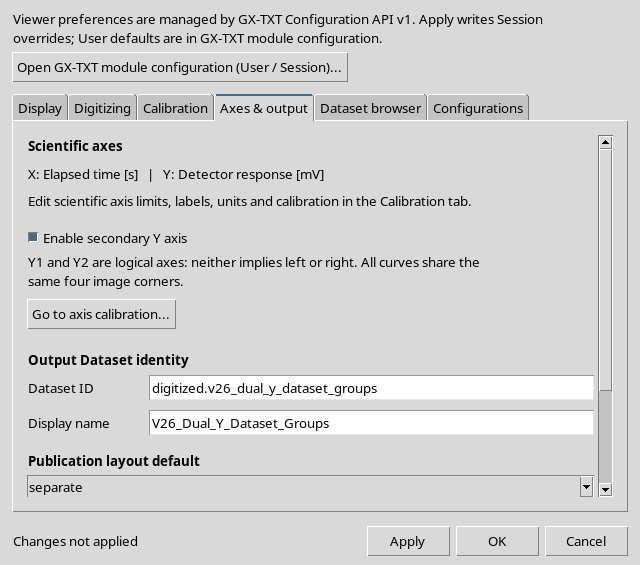
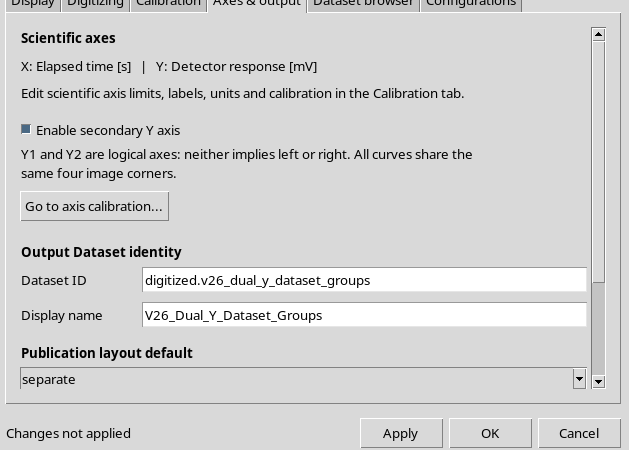
In Configuration → Viewer settings… → Axes & output, the Enable secondary Y axis checkbox lets you introduce Y2 into the current configuration.
We tick the checkbox and press Apply, then OK. This operation does not add a new image or move the four calibration corners.
4. Declaring the X, Y1 and Y2 Quantities
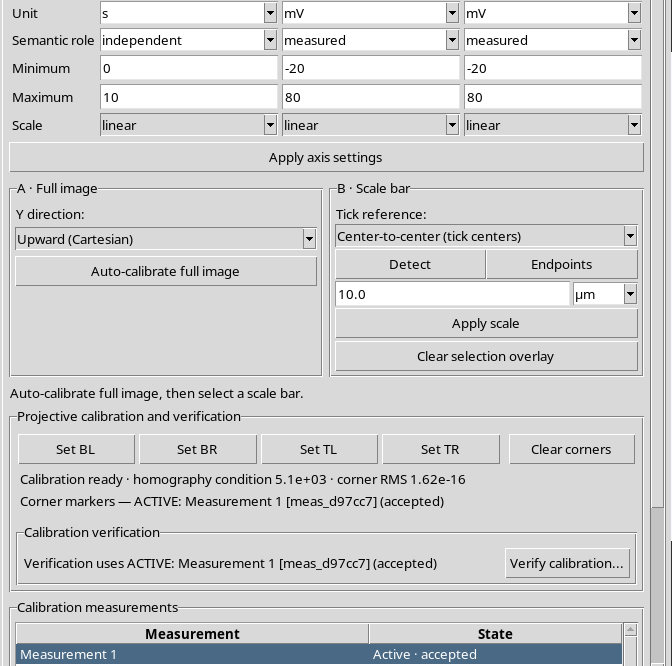
The Calibration tab now shows three columns for the scientific meaning of the axes: X, Y1 and Y2.
Y1 and Y2 represent distinct logical variables; neither automatically implies a position on the left or right of the plot.
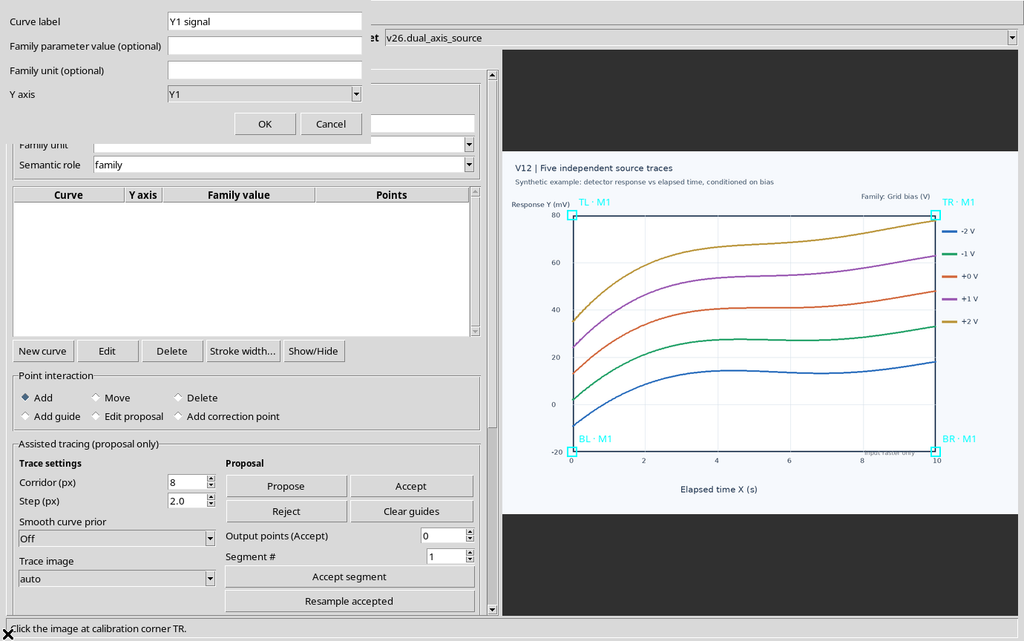
5. Creating the Y1 Curve
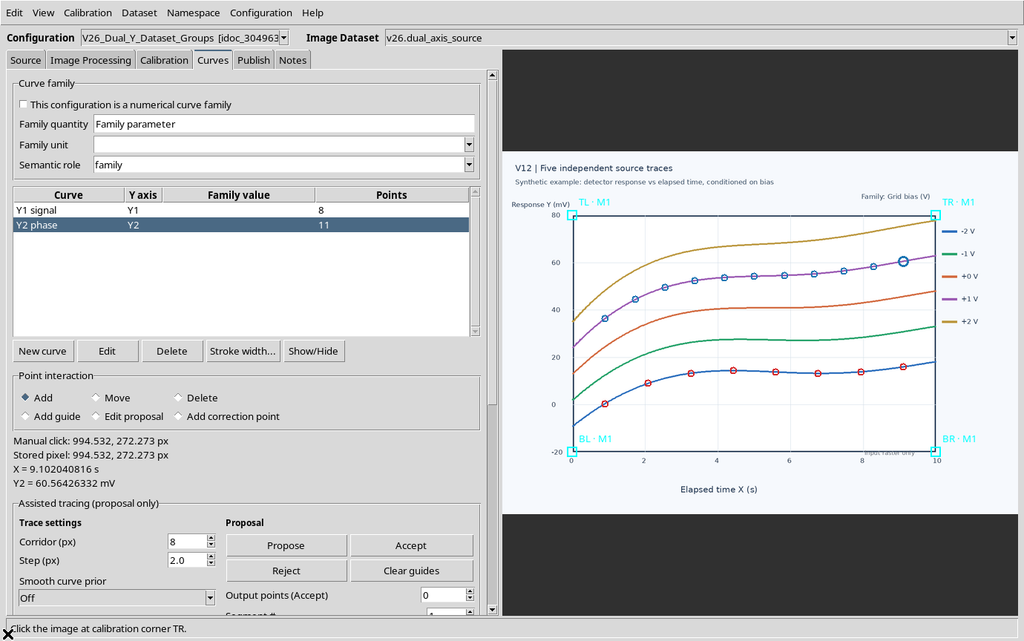
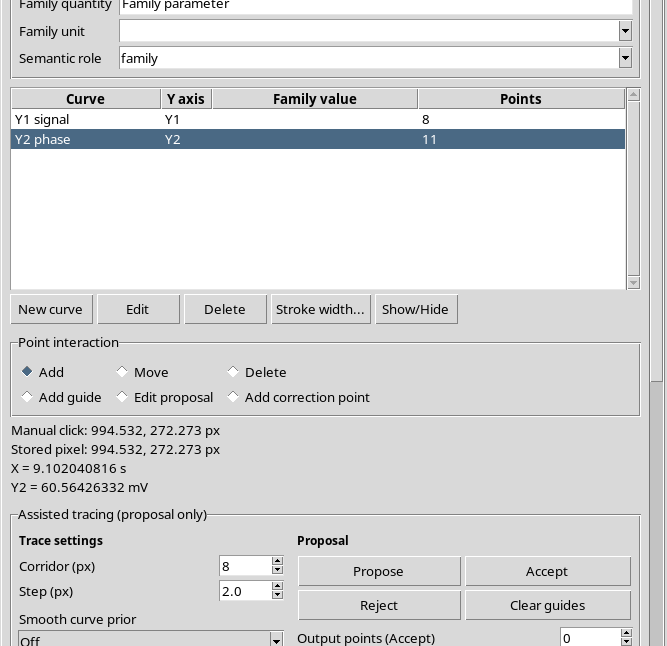
In the Curves tab we press New curve and enter the name Y1 signal. In the Y axis field we choose Y1.
The scientific ID of the curve is not its displayed name; it will remain available even if the label changes.
6. Creating a Curve Associated with Y2
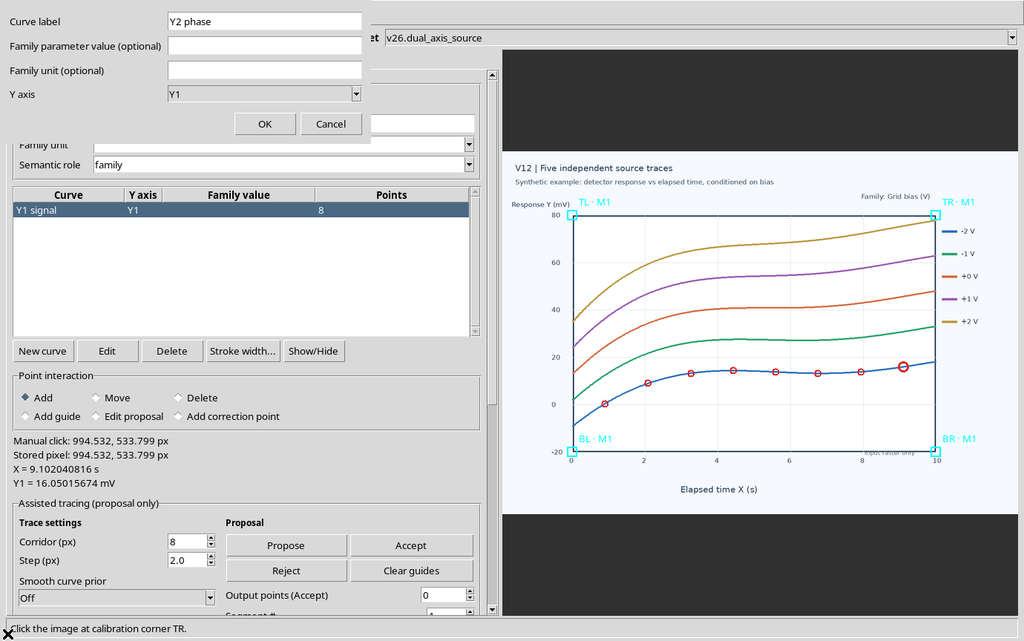
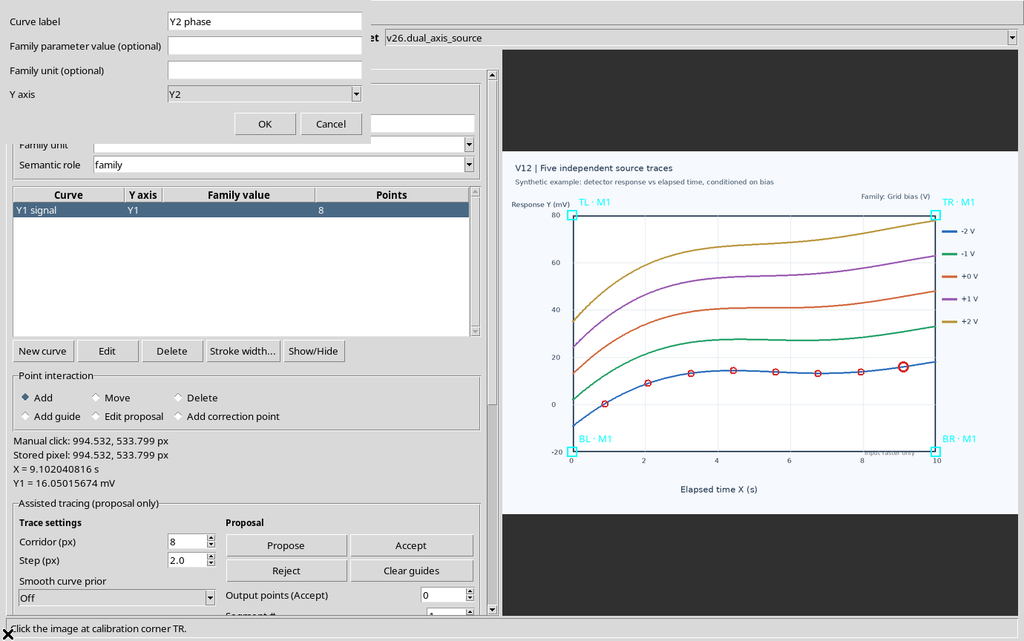
We create a second series named Y2 phase. In the creation dialog, the Y axis selector offers the options Y1 and Y2.
We explicitly choose Y2 before confirming. The stroke colour does not determine the axis: it is the link recorded by the GUI that constitutes the scientific declaration.
7. Acquiring Different Points for the Two Series
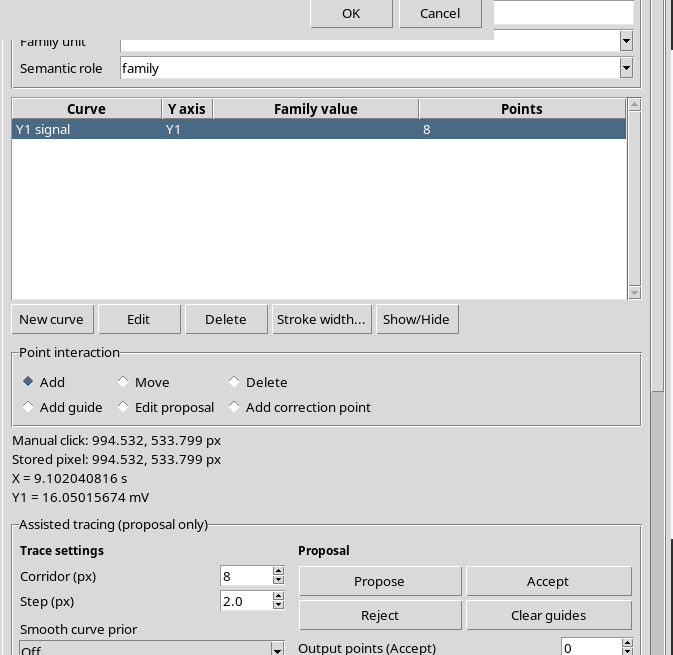
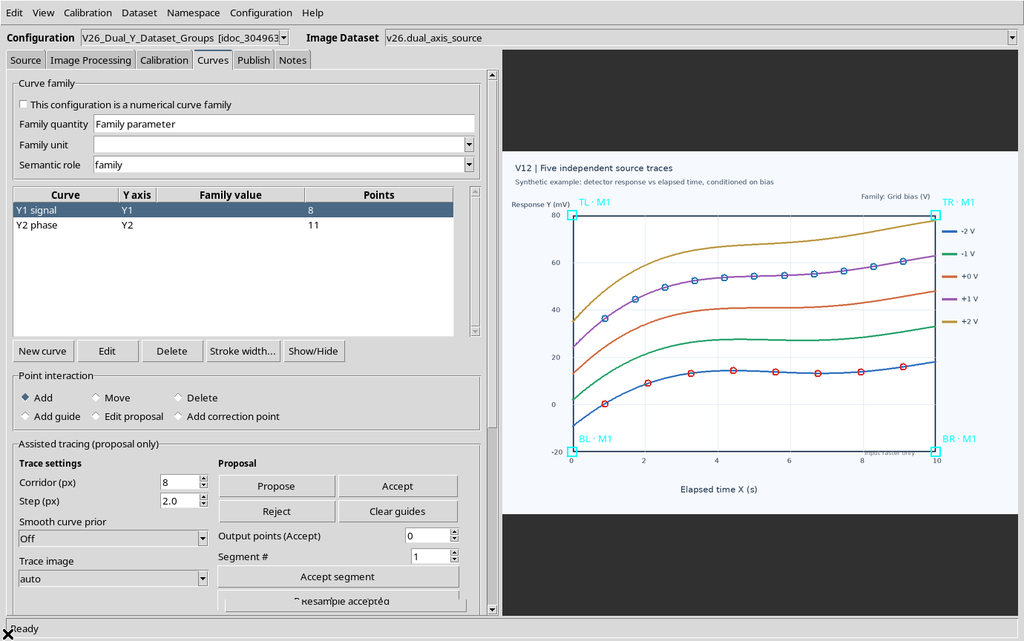
Using Add, we digitize 8 points for Y1 and 11 for Y2, for a total of 19 manual points.
The two curves keep different numbers of points and distinct original identifiers. There is no need to interpolate further points in order to publish them.
8. Three Fundamental Identities
The result must preserve three concepts: curve_key, the stable identifier of the series; y_axis_id, which declares Y1 or Y2; point_id, which identifies the original point. The curve name, instead, is descriptive.
The order of the points is expressed by the point_order role, with origin zero within each curve. Grouping must not be reconstructed from the line colour or from a global ordering by X.
To reconstruct the result correctly, read curve_key and y_axis_id as distinct pieces of information: the first identifies the series, the second indicates which scientific axis to interpret its Y values on. point_id, instead, allows the position acquired on the raster to be recognized. In our example the internal orders run from 0 to 7 for Y1 and from 0 to 10 for Y2: they do not form a single sequence of nineteen samples.
9. Case with Equal Units
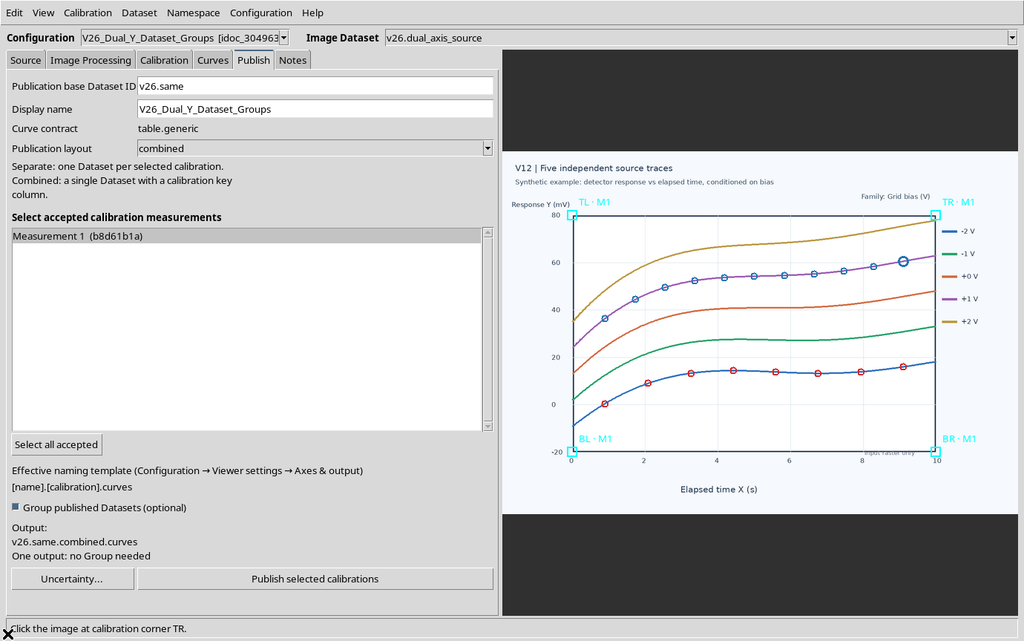
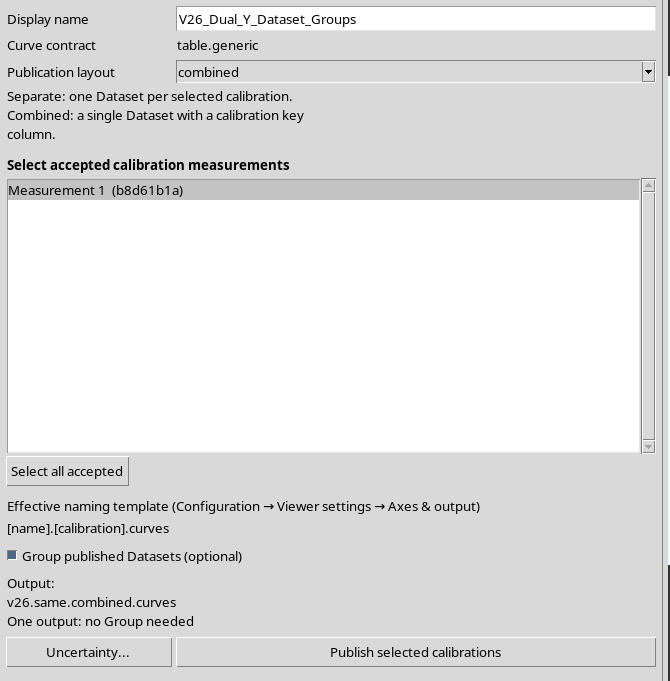
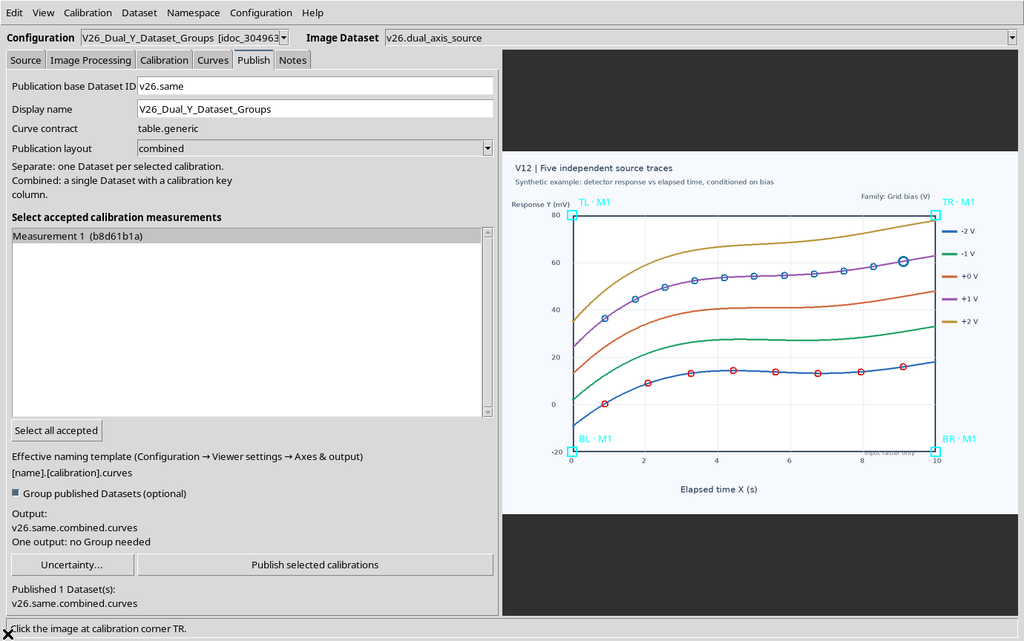
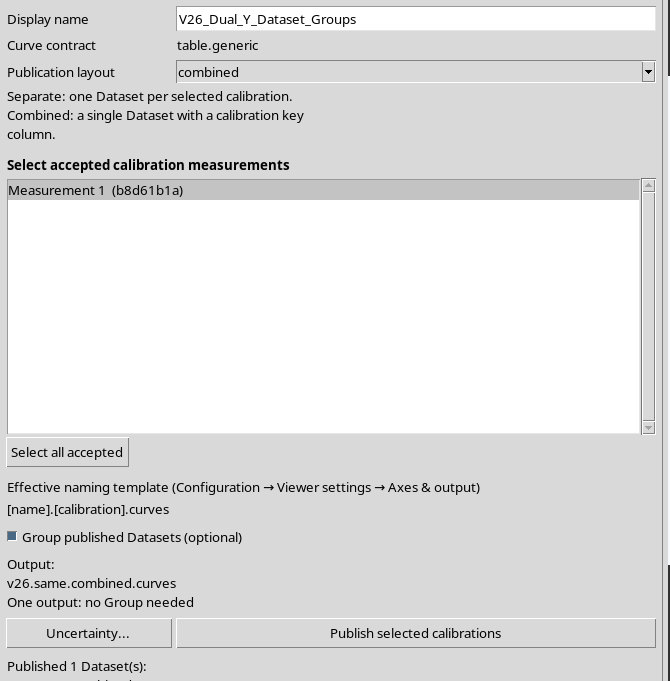
Initially Y1 and Y2 are both declared in mV. In the Publish tab we choose Combined with a single accepted calibration.
The GUI plans a single mixed Dataset. The two series can share a Y column because all the rows declare the same physical unit.
10. Publishing the Mixed Dataset
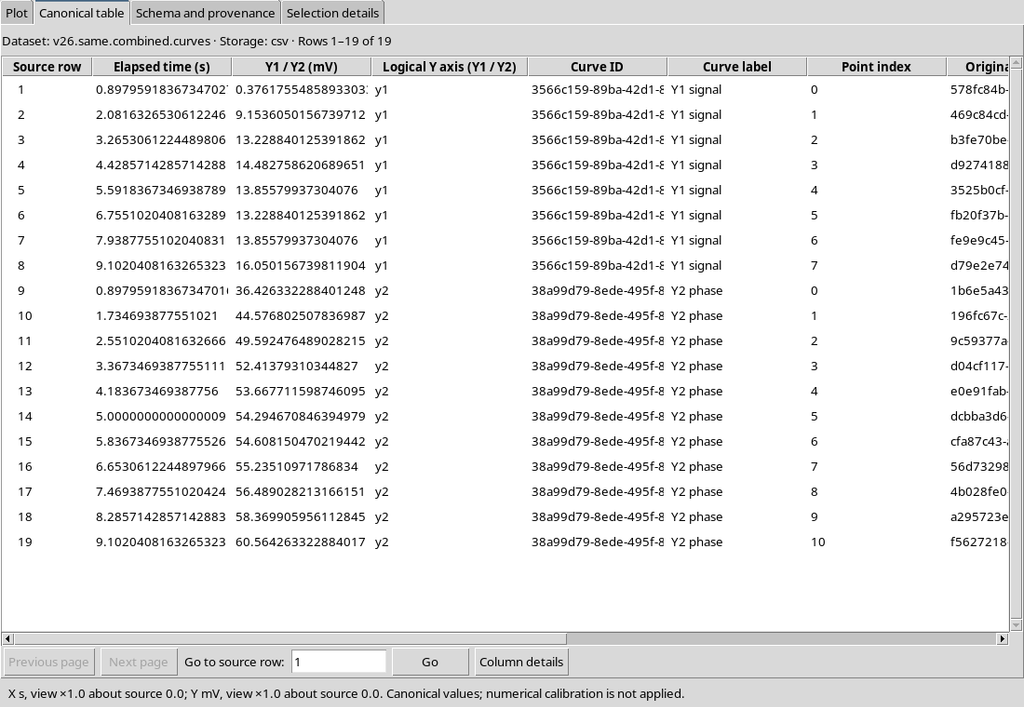
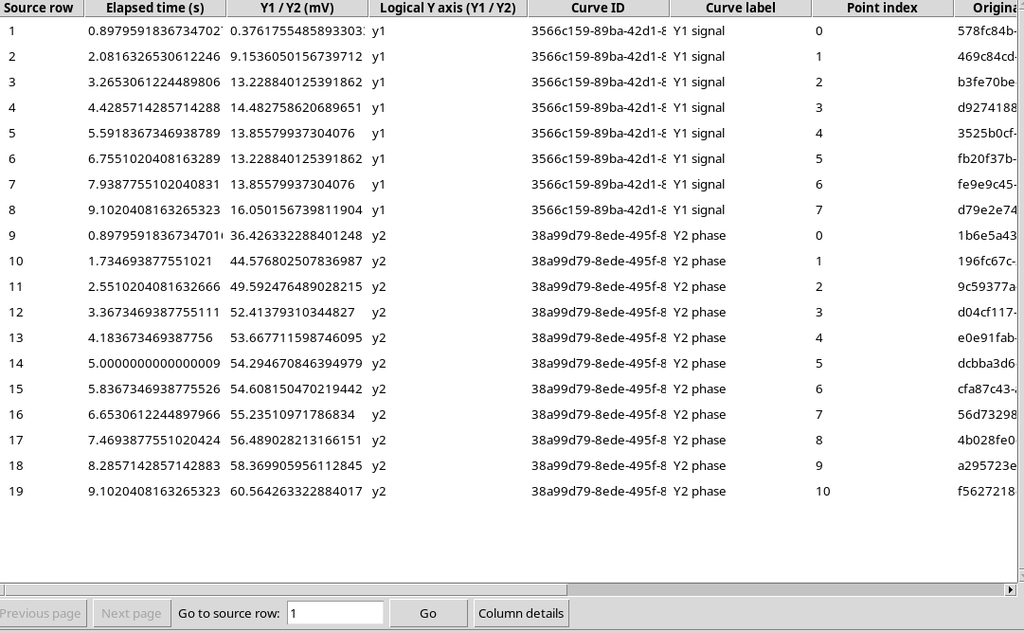
We press Publish selected calibrations. The result is a canonical table.generic Dataset of 19 rows.
The y_axis_id column distinguishes the 8 Y1 rows from the 11 Y2 rows; the point and the curve keep their original identities.
11. Group Selected but Only One Output
The Group published Datasets (optional) checkbox does not force the creation of a Group when the plan produces a single Dataset.
A Dataset Group serves to link several existing canonical Datasets. With a homogeneous table that is already complete, no additional container is needed.
The checkbox choice concerns the possible grouping of the output, not the number of curves present in the document. When the units coincide, Y1 and Y2 are kept in the same 19-row Dataset: y_axis_id identifies which axis each row belongs to. The result is verified in the Publish message and in the CORE catalogue: a single Dataset does not require a Group with two members.
12. Changing the Scientific Unit of Y2
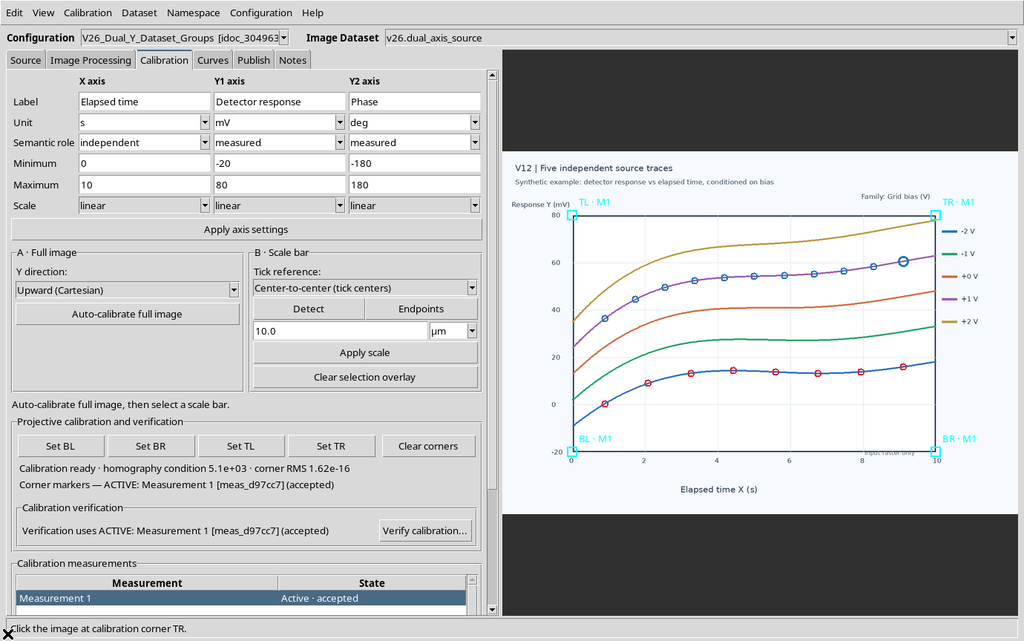
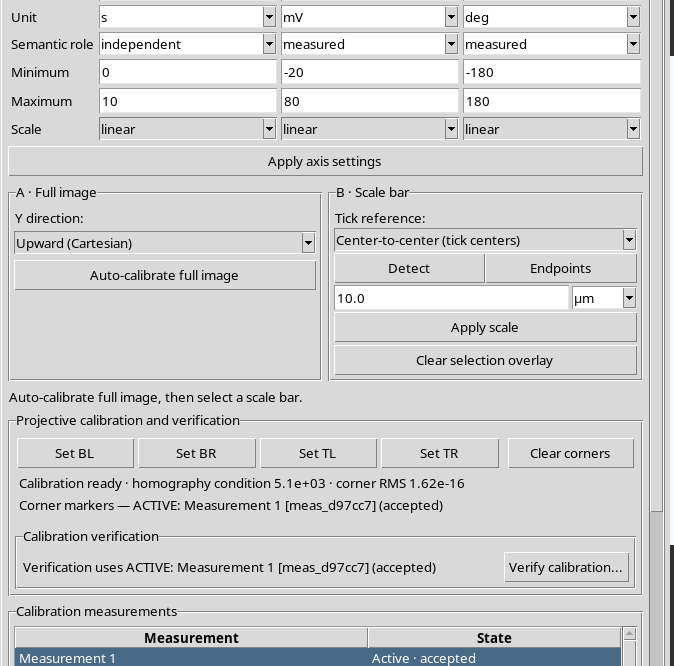
In the second scenario we set Y2 as Phase, with unit deg, minimum −180, maximum 180 and linear scale.
Y1 remains expressed in mV. After Apply axis settings the document has two physically different Y quantities.
13. The Original Points Do Not Move
The new Y2 declaration changes the mapping of the scientific coordinates of the second curve, not its point_id values or the original pixel positions.
The coordinates of the Y1 points remain unchanged. A change of unit and limits is a new scientific interpretation, not an automatic conversion of the Y1 unit: it must be justified by the graph being studied.
To check the change, compare raster coordinates and scientific coordinates separately. The pixels and the point_id values of Y2 always represent the eleven original clicks, while the numerical Y values now follow the Phase scale from −180 to 180 degrees. The eight Y1 points continue to be interpreted in millivolts. This is not a matter of converting millivolts into degrees: what changes is the scientific quantity associated with the second trace.
14. Preview with Two Incompatible Units
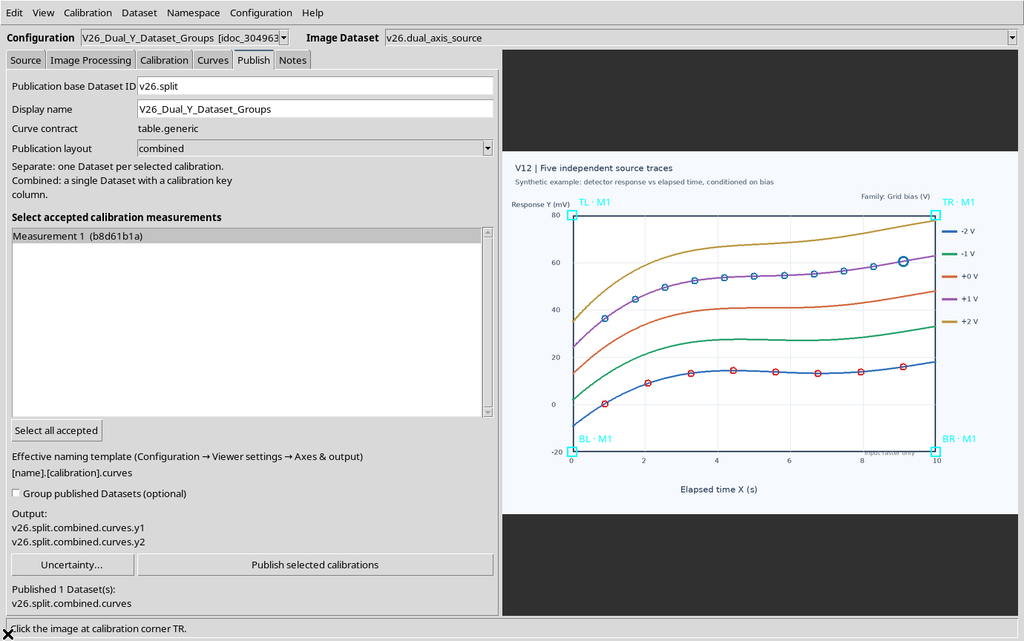
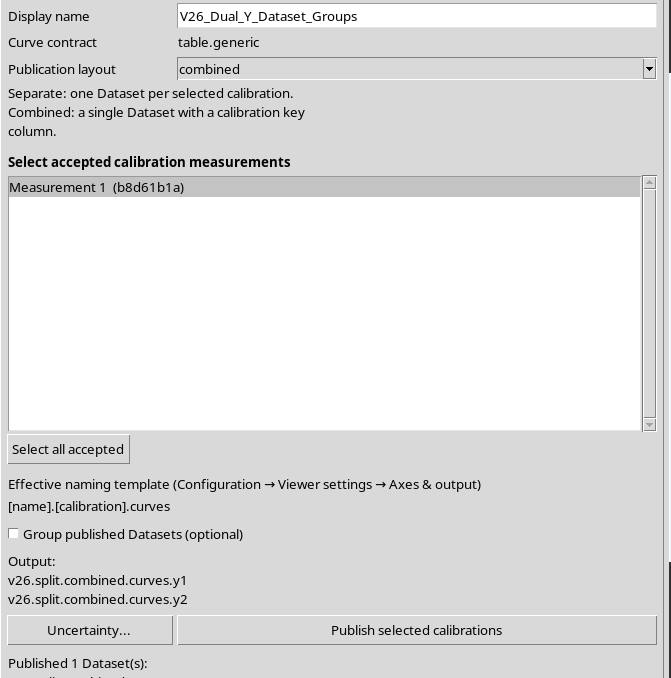
Even keeping Combined as the calibration layout, publishing produces two Datasets when the Y units are incompatible.
The preview distinguishes the results with the suffixes y1 and y2. A single numerical Y column cannot declare millivolts and degrees at the same time.
15. Publishing the Two Results Without a Group
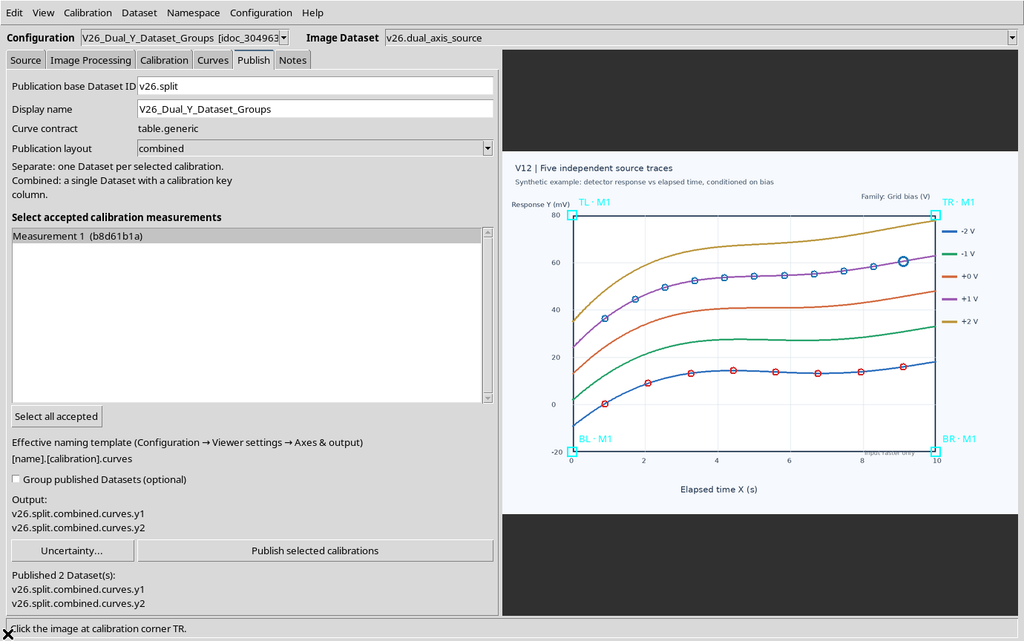
We temporarily disable Group published Datasets and publish.
The result comprises one Dataset with 8 Y1 rows in mV and another with 11 Y2 rows in deg. Both are available in the Session catalogue.
16. What Separation by Unit Means
Splitting by unit does not lose data and does not change the pixels. The two tables together still contain 19 points.
The Combined/Separate layout concerns the handling of calibration realizations; the separation by Y1/Y2 is additionally bound to the compatibility of the physical units published in the Variable Schema v3.
The split into two tables is imposed by the non-homogeneity of the Y units: a canonical numerical column must not represent mV and deg at the same time. Therefore a Y1 Dataset with eight rows and a Y2 Dataset with eleven rows are obtained, each with its own variable schema. This criterion is distinct from the Separate or Combined choice relating to calibrations. Both results remain linked to the same source and keep their respective original points.
17. Enabling the Dataset Group
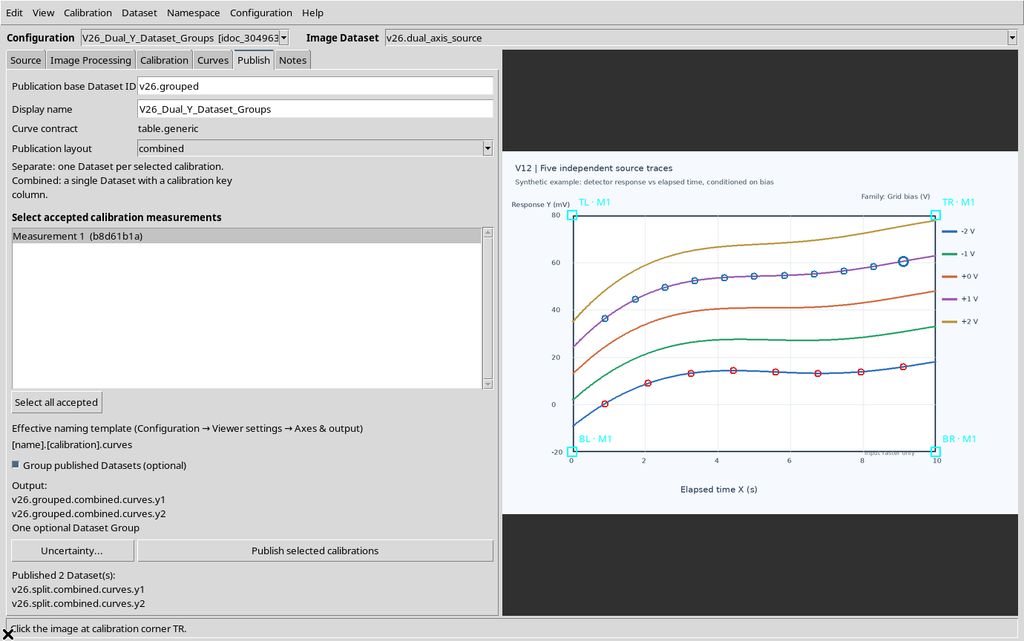
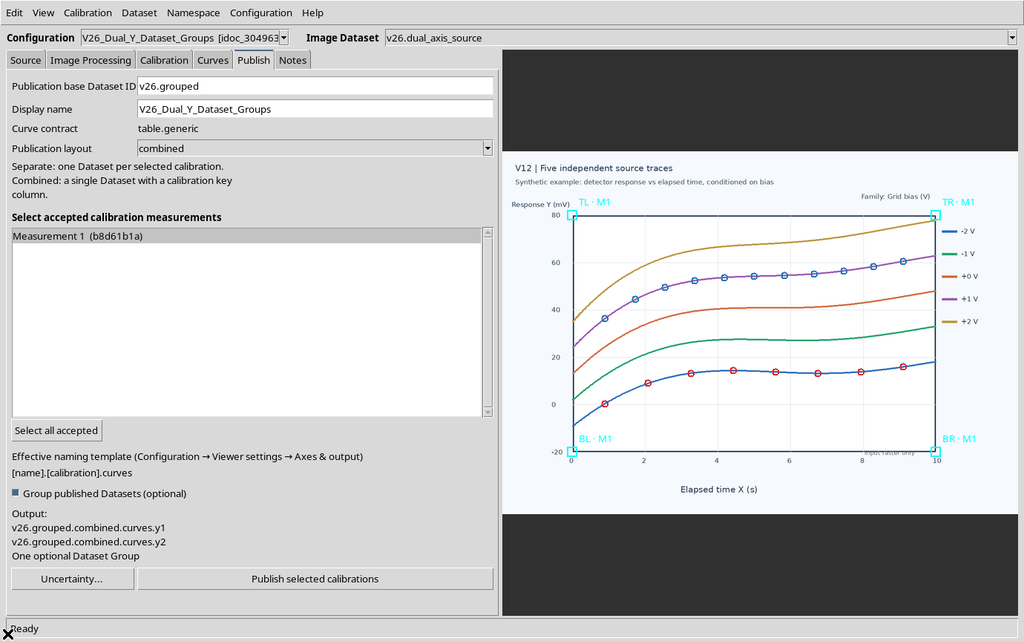
To link the two outputs, we enable Group published Datasets (optional) in the Publish tab.
The preview shows two scientific Datasets and an optional Group. Ticking the checkbox does not create a further numerical column and does not convert degrees into millivolts.
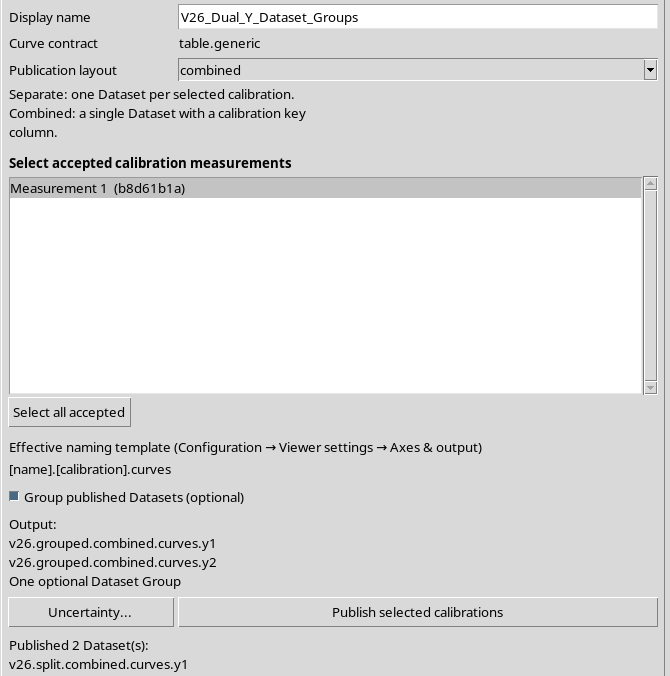
18. Creating the Group from the GUI
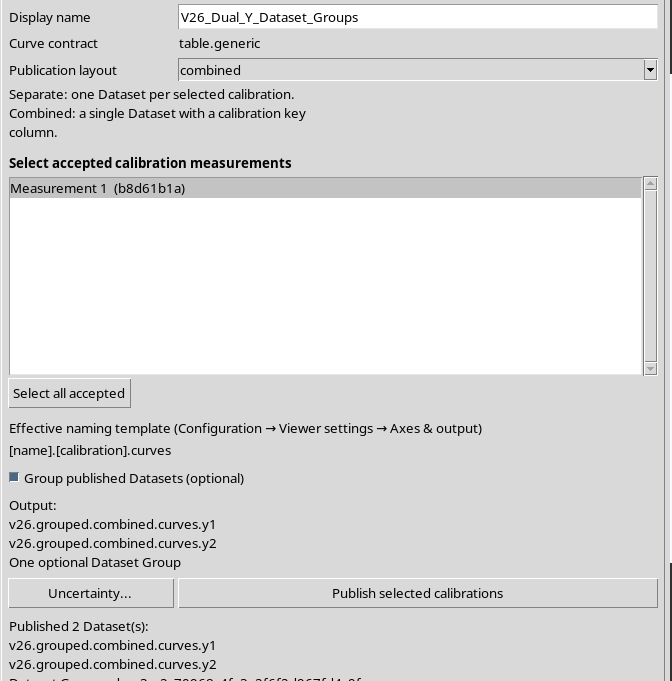
We confirm Publish selected calibrations. The Viewer registers two canonical Datasets and requests a Dataset Group from the authorized producer.
The final message reports the identifiers of the two Datasets and of the new Group. The Group ID is opaque and must not be reconstructed manually.
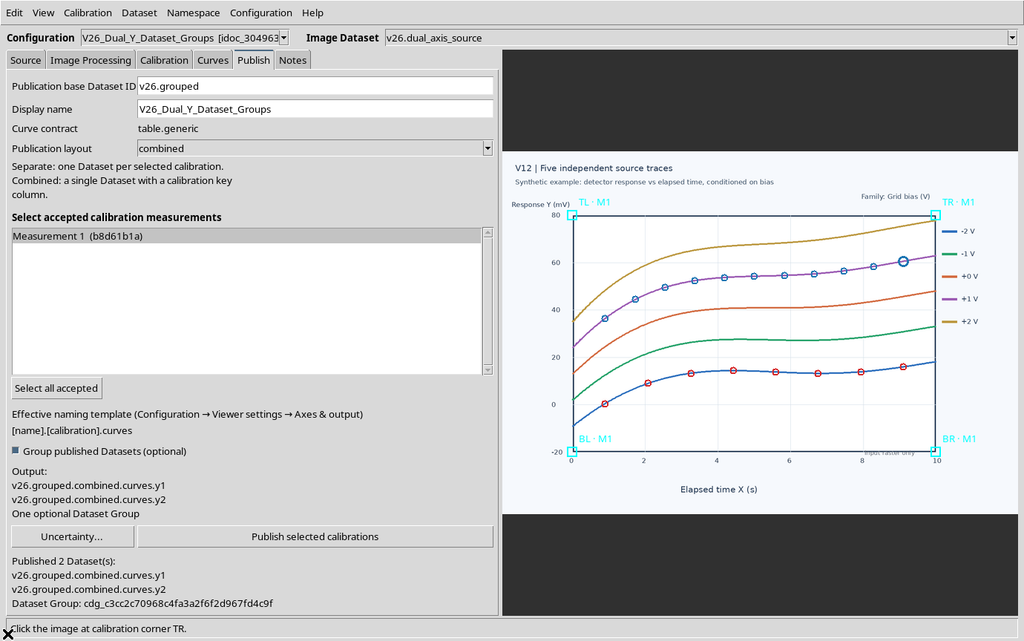
19. The Group in the CORE Catalogue
In the GX-TXT Dataset browser a parent node appears with two child members.
The roles of the members are curve_digitizer.axis.y1 and curve_digitizer.axis.y2. The structure shows that the association does not replace the original numerical tables.
In the Dataset browser, identify the Group node and check its list of members before opening their data. The curve_digitizer.axis.y1 role identifies the Dataset of the quantity in mV, while curve_digitizer.axis.y2 identifies the one in degrees. The two members can be opened individually: each still has its own canonical table, with eight or eleven rows. The parent node describes the relationship between the Datasets, not a new numerical variable.
20. Inspecting the Group
From the node’s context menu we select Inspect Group….
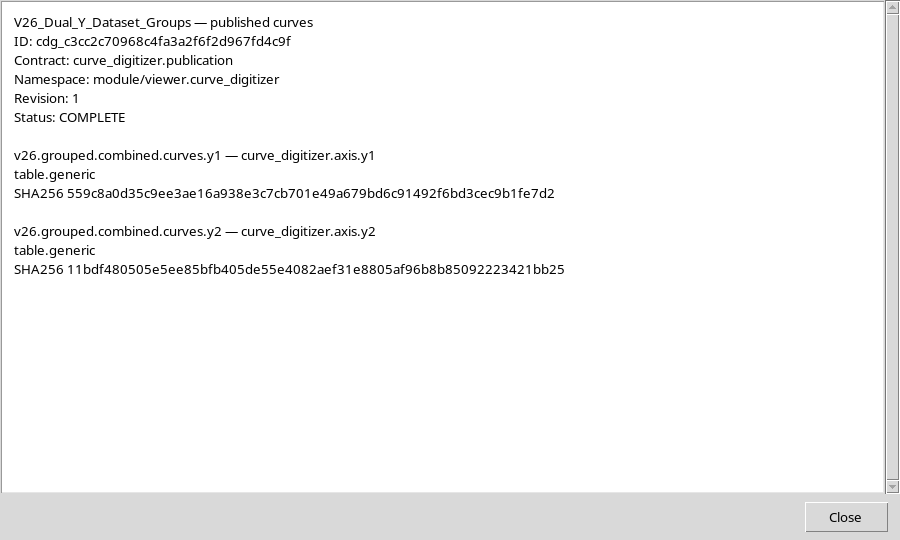
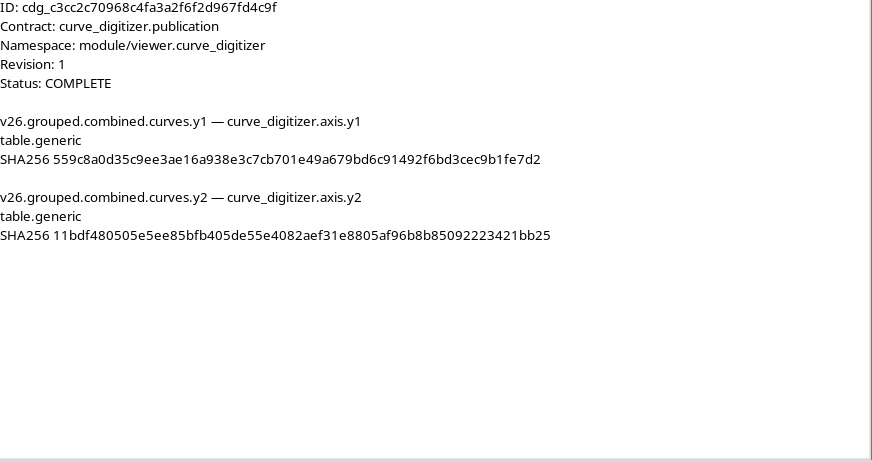
The window shows identity, contract, status, members, roles and SHA-256 fingerprints. This is the correct way to check whether the Group really contains the requested results.
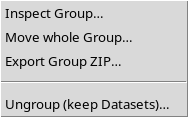
21. The Meaning of COMPLETE
In our example the CORE reports status COMPLETE: the two required members are present and consistent with the contract and the registered fingerprints.
A Group is not just a list of names. If a member were missing, had different content or had been moved in an incompatible way, the inspection could report a degraded status.
The COMPLETE status concerns the consistency of the grouping, not the scientific completeness of the experiment. In particular, the CORE can compare the Group references with the available members, their contracts and the registered fingerprints. This check does not certify that the point tracing is accurate, nor that the Y1 and Y2 quantities are convertible into each other. Data integrity must therefore be distinguished from its physical interpretation.
22. Identity and Revision of the Group
The manifest includes group_id, revision, primary_dataset_id, members and group_contract. The Group contract is curve_digitizer.publication; the members keep their own table.generic contract.
The Group keeps the references to the identities and digests of the Datasets. It does not store a second copy of their numerical rows.
In the inspection, group_id identifies the overall relationship, while primary_dataset_id and members identify the Datasets it refers to. The revision field belongs to the Group manifest and is not an index of the digitized points. The references and digests make it possible to distinguish a publication structure from a simple list of names, without replicating the contents of the two tables.
23. Viewing the Mixed Case in the CORE
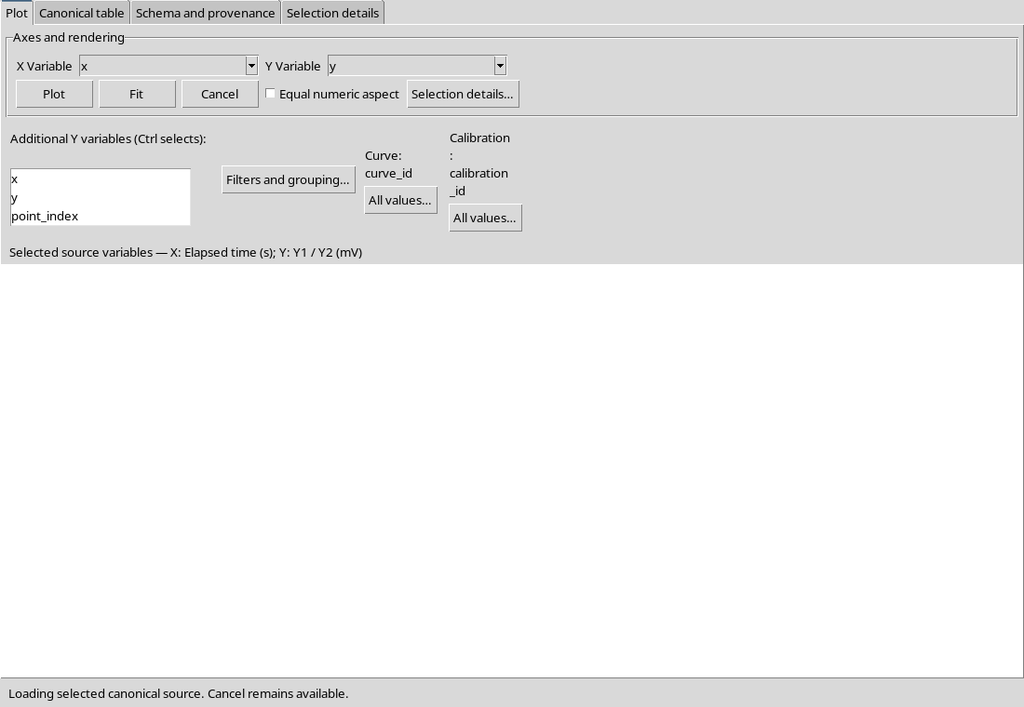
We open the Dataset published when Y1 and Y2 shared the mV unit in the CORE Scientific Dataset Viewer.
The Canonical table contains 19 rows and keeps the Y1/Y2 link. The Plot view is a preview; it does not replace reading the schema.
24. Curve Schema v2 and y_axis_id
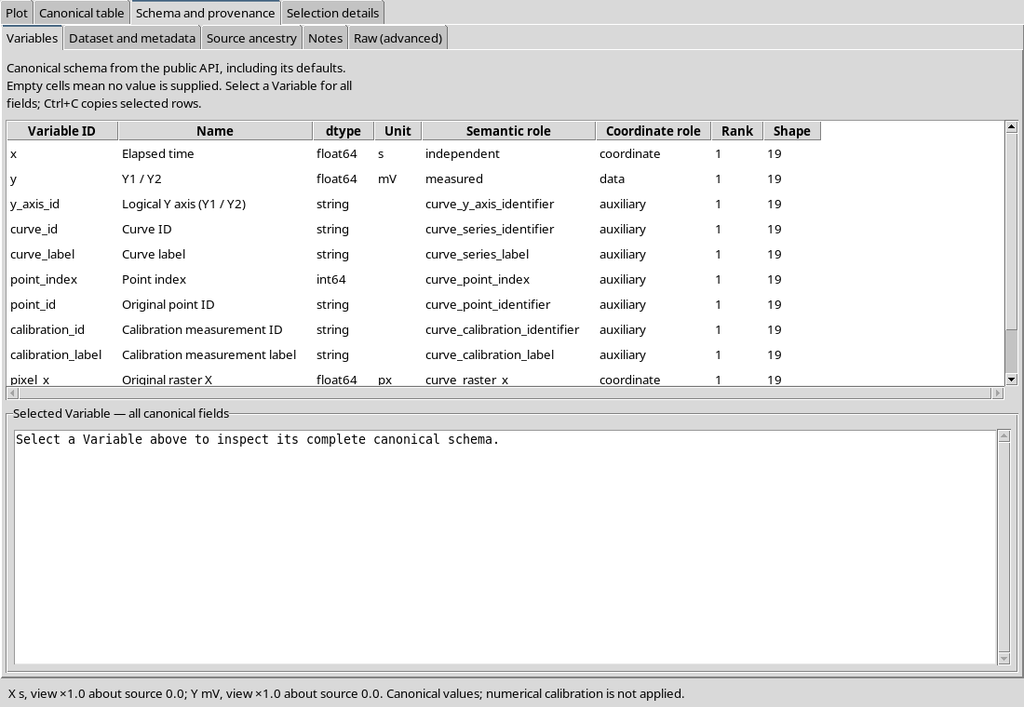
In the Variables tab the text variable y_axis_id appears.
The Curve Digitalizer schema 2 contract keeps the Y1/Y2 identity for each row. Consumers must resolve its role from the public API, not deduce the variable from the position it occupies in the CSV.
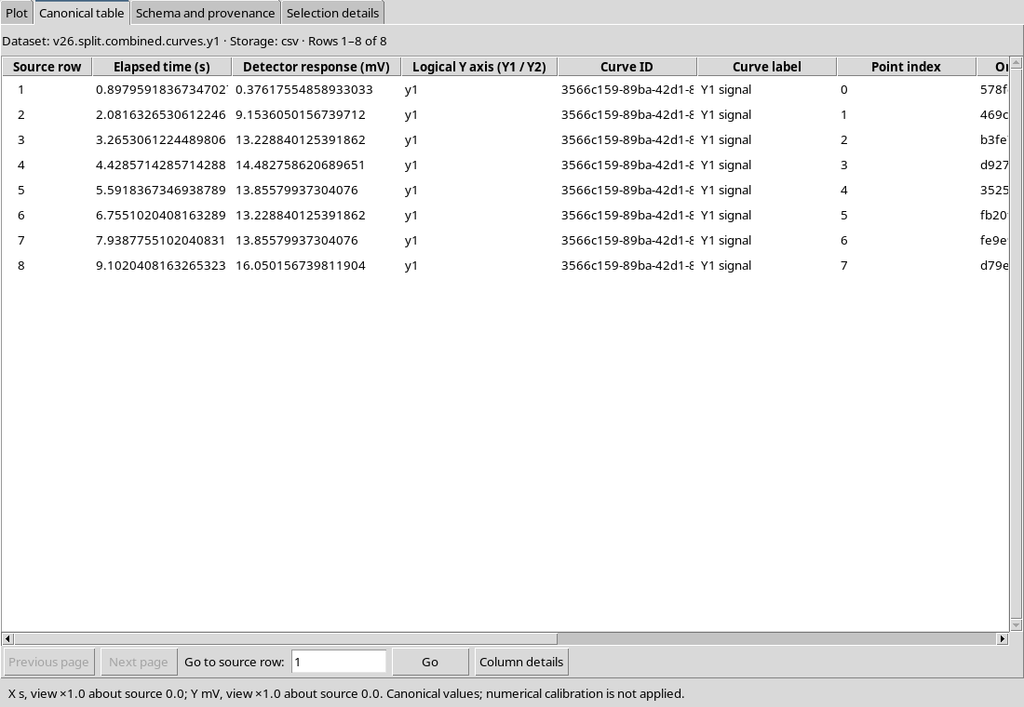
25. Viewing the Separate Y1 Dataset
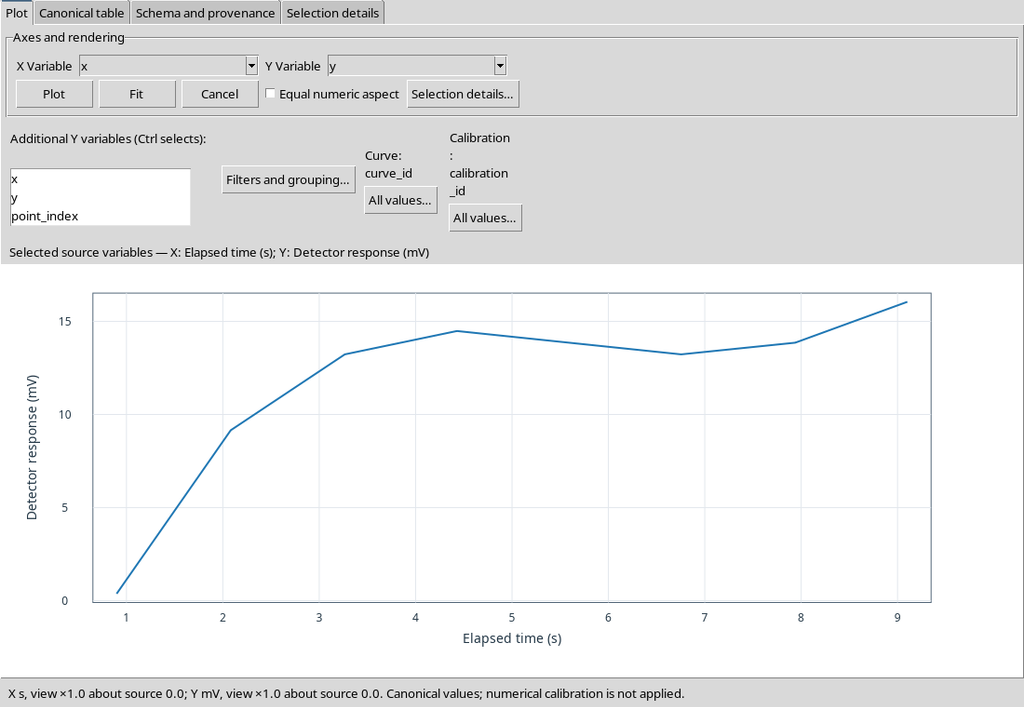
We open the Y1 result of the publication with different units.
The CORE shows 8 rows, all associated with the first curve, with the Y variable in mV and the raster coordinates still available.
26. Viewing the Separate Y2 Dataset
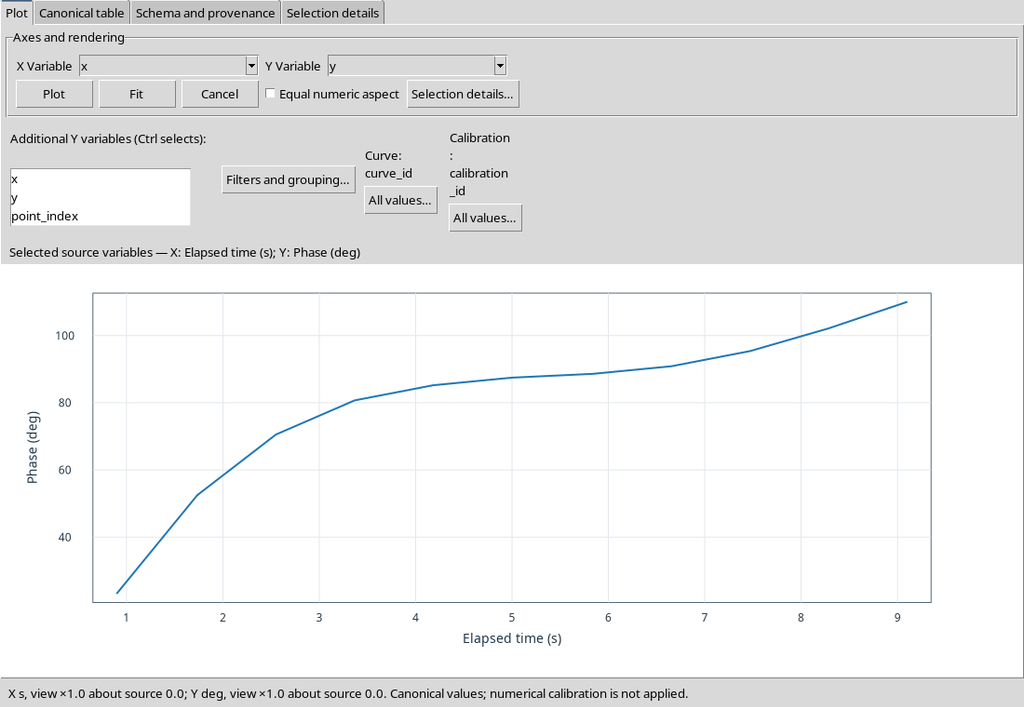
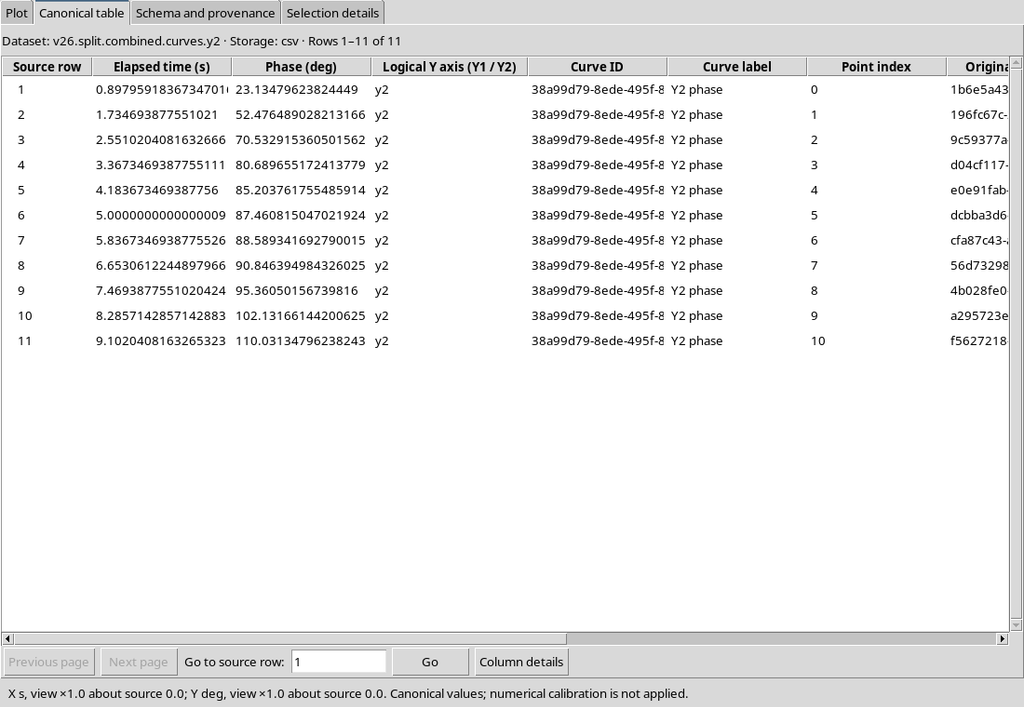
We open the Y2 Dataset with unit deg.
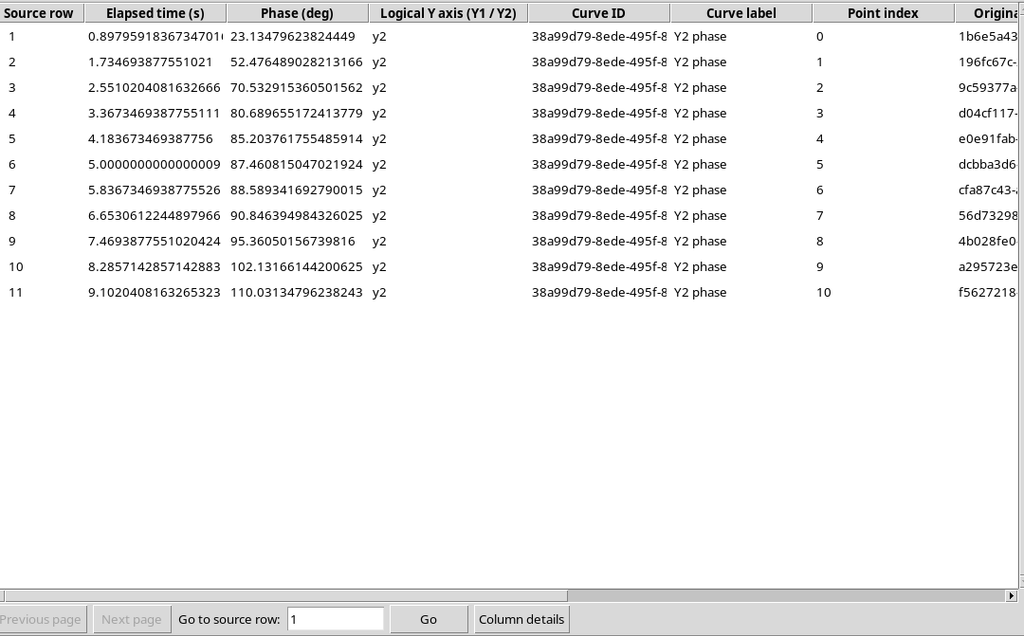
The Canonical table contains 11 rows of the second curve. Their physical quantity is distinct from the one published for Y1.
27. The Group Does Not Perform Numerical Calculations
The Dataset Group does not calculate averages, does not perform fitting, does not convert units and does not estimate uncertainties or correlations.
A Group is a publication relationship between canonical objects. Any downstream processing requires numerical software and explicit scientific assumptions.
For example, the Group makes it possible to find the Y1 response in millivolts and the Y2 phase in degrees together, but it does not produce a table with a single Y and does not perform transformations between quantities. To compare or plot the two series, each member must be read according to its units and its X coordinates; any interpolation or joint analysis requires explicit processing and a scientific justification distinct from simple membership of the Group.
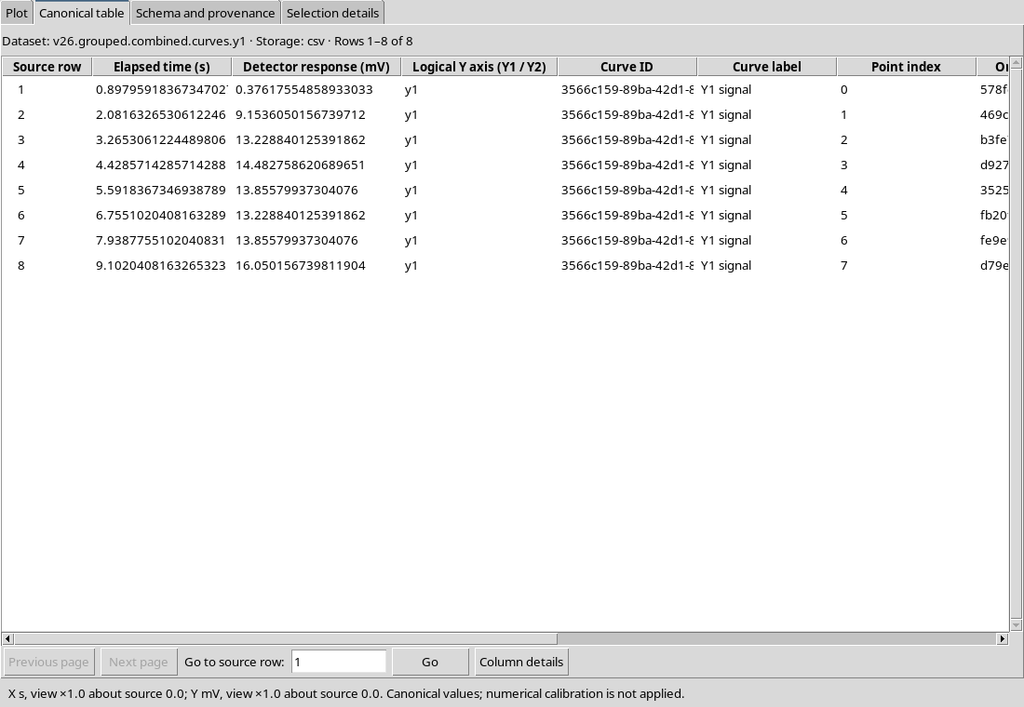
28. Opening the Y1 Member of the Group
From the browser we open the Y1 member.
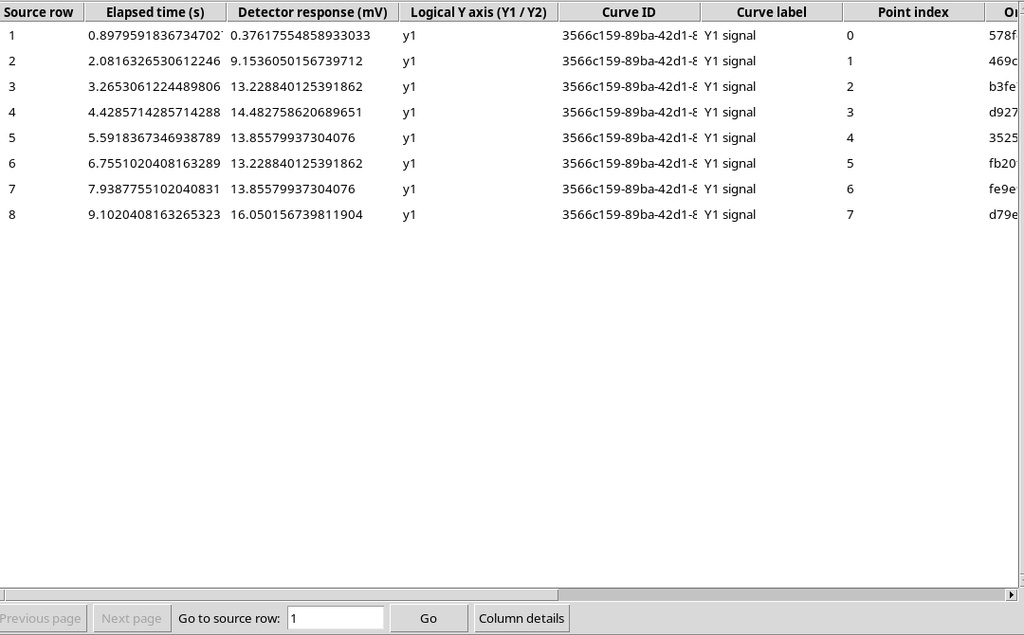
Its Dataset keeps 8 rows and the original coordinates. Comparison with the Y1 output published without a Group confirms that the canonical CSVs and SHA-256 values are identical.
29. The Y1 Member in the Schema and Provenance
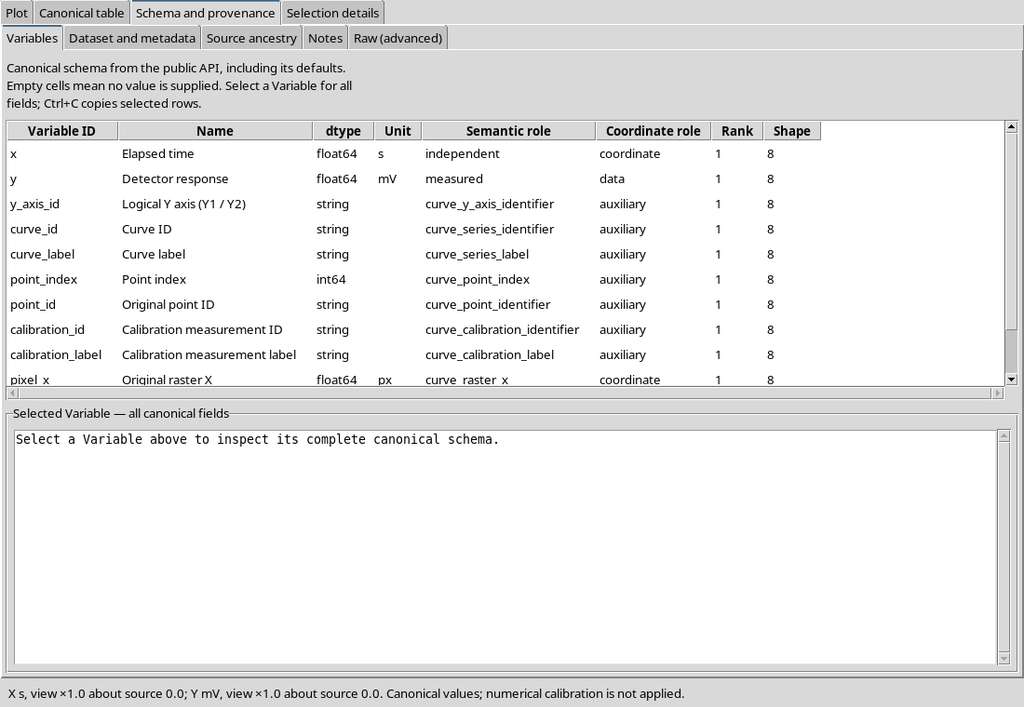
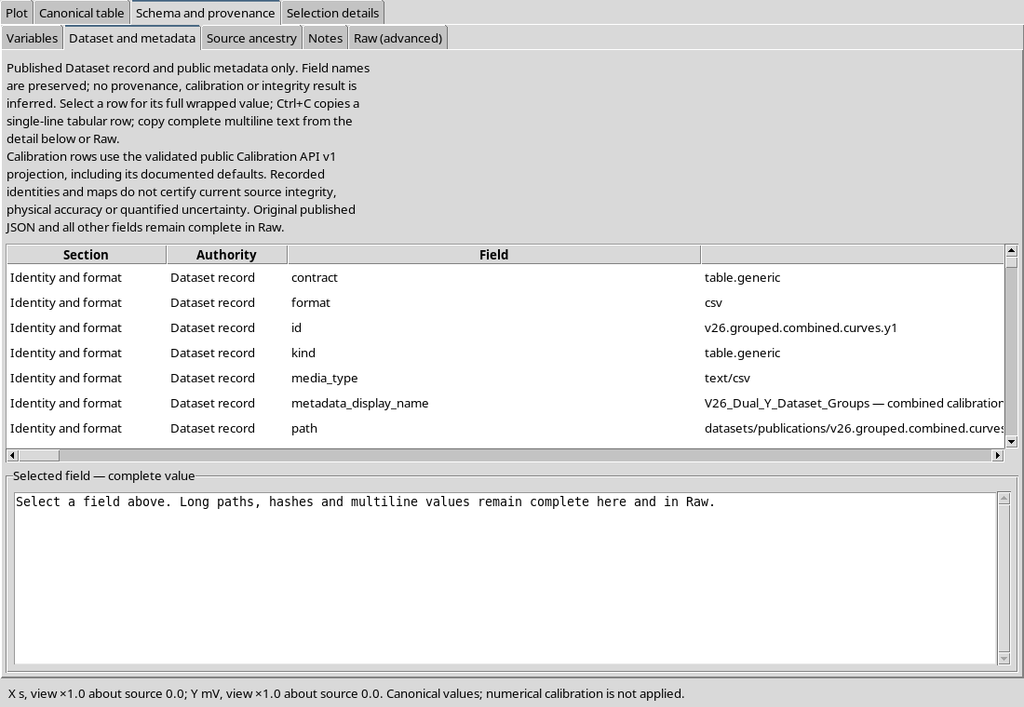
The Variable Schema v3 describes Y in mV and the y_axis_id field.
The metadata preserve the source and the link to the logical axis, without introducing a new measurement or duplicating the data of the first trace.
30. Opening the Y2 Member of the Group
We also open the second member.
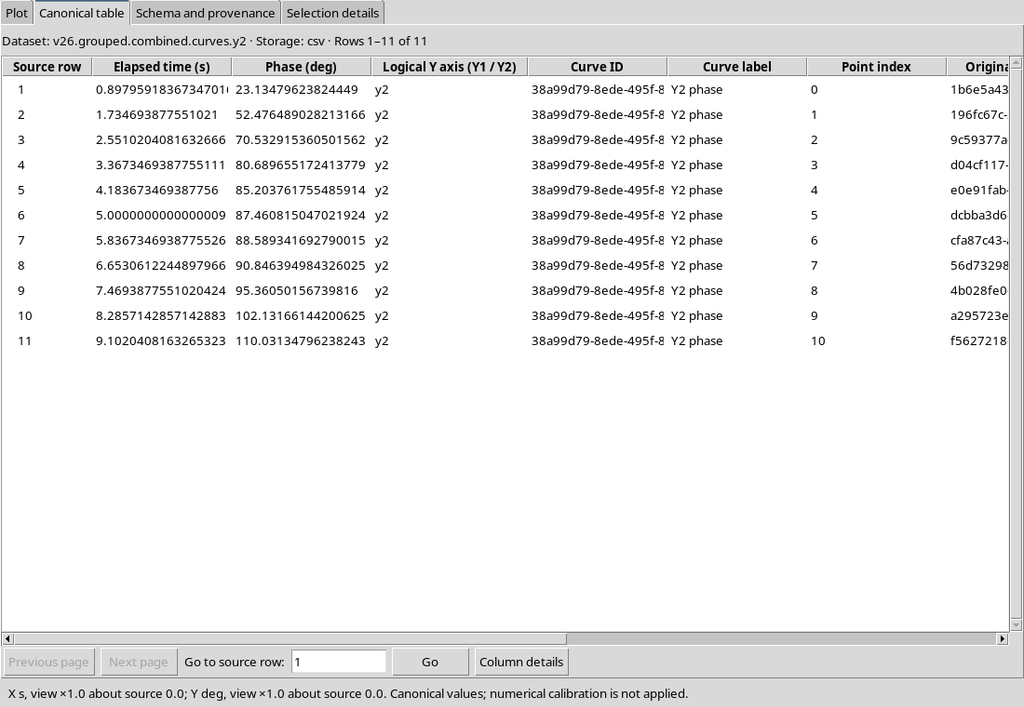
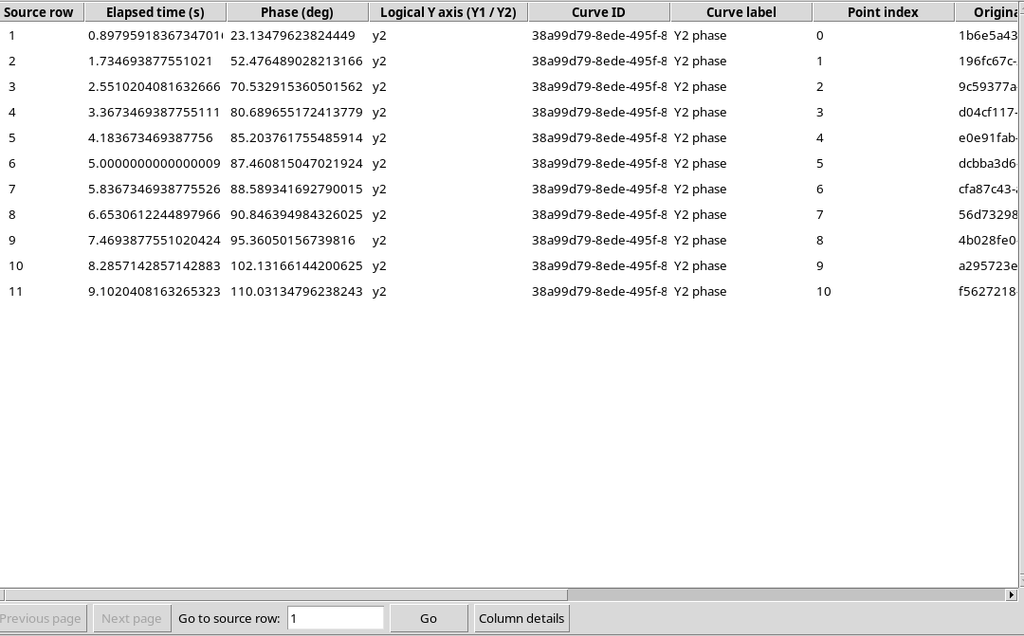
The Dataset contains 11 rows, in degrees, with the same point_id values and pixels as the previous ungrouped Y2 output. For Y2 too, the canonical content is identical before and after grouping.
31. Verifying the Schema and Ancestry of Y2
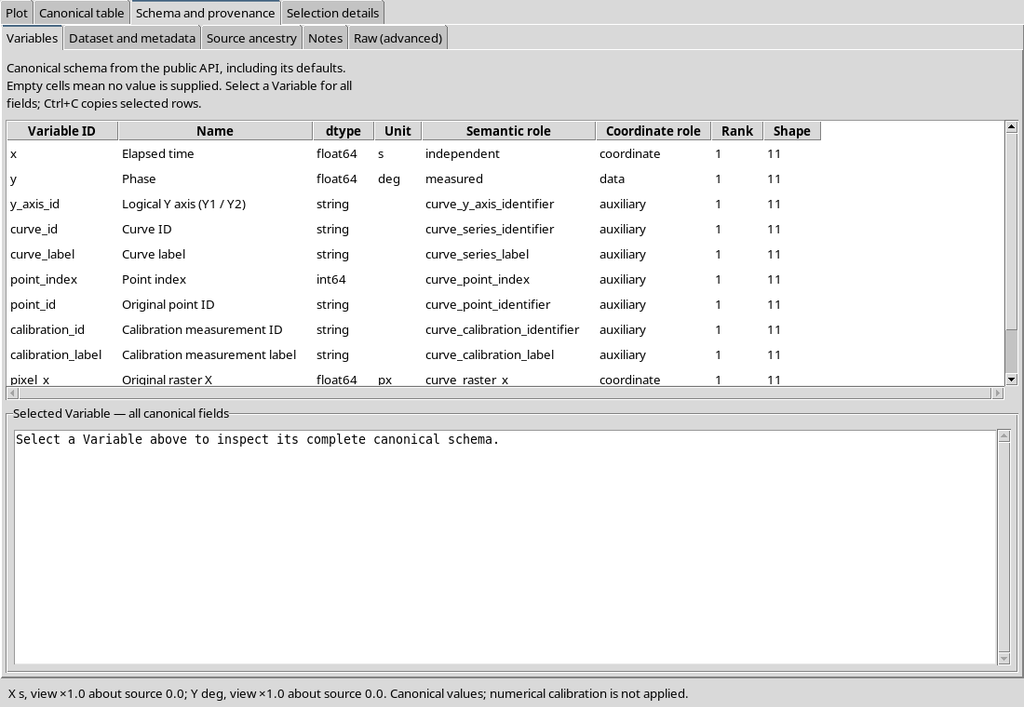
In the Variables tab the Y quantity is declared in deg and the curve is linked to Y2.
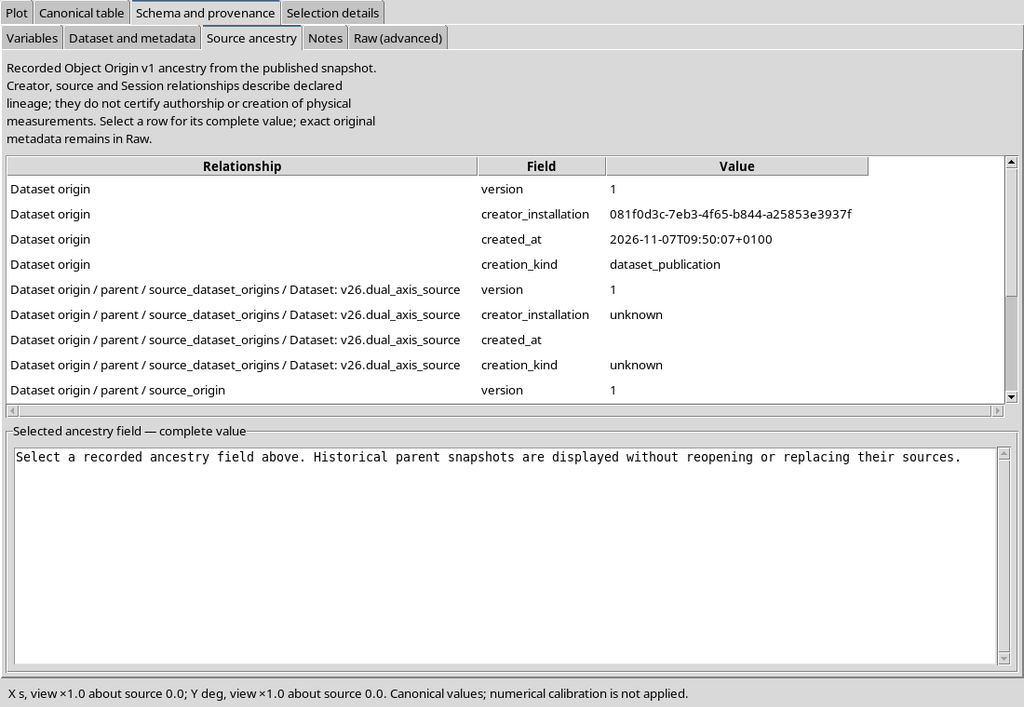
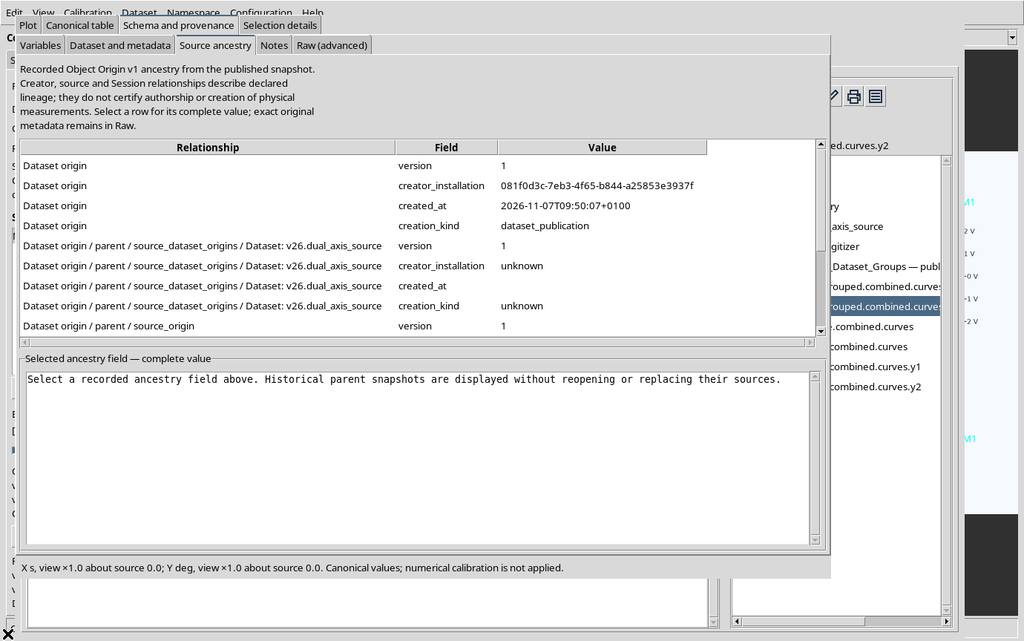
The Source ancestry section traces the member back to the original raster. No Group operation has altered the source.
32. Comparing the Two Outputs and the Two Members
| Quantity | Standalone output | Group member |
|---|---|---|
| Y1, mV | 8 rows | 8 identical rows |
| Y2, deg | 11 rows | 11 identical rows |
| Source points | 19 | 19 |
The Group relationship does not generate a third series of 19 points. It keeps a reference to each of the two Datasets, with different scientific roles.
33. Namespace, SHA-256 and Revision
The CORE Dataset Group API binds each member to the contract, the revision and the canonical digest. The members must meet the namespace and identity conditions required by the CORE.
In the demonstration publication the status is COMPLETE and the revision is 1. Do not modify the Group files directly: use the authorized public operations of the framework.
A useful check consists of reading the Group manifest and comparing identifiers, roles and digests with the Datasets actually present in the Session catalogue. The SHA-256 fingerprint serves to verify the content of a member, while the Group revision concerns the document that describes their relationship. Revision 1 shown in the example is not a version of the Curve Digitalizer. To preserve this traceability, do not manually rename or rewrite the canonical objects.
34. If the Group Is Not Created
Publishing the Datasets and the subsequent creation of the Group are not necessarily a single atomic transaction. If grouping fails, the Datasets already published may remain valid.
Check the GUI message and the browser before repeating an operation. Do not assume that a Group error has automatically deleted the previous tables.
If the final message does not confirm the Group, first check whether the two Y1 and Y2 Datasets were registered anyway. Their presence in the catalogue does not prove, on its own, that the parent node also exists. Examine the outcome of the numerical publication and that of the Group creation separately; only then identify the operation to repeat, avoiding duplicate publications or ID collisions. A possible grouping problem must not be confused with an automatic loss of data already published.
35. Saving the Configuration
We use Configuration → Save configuration.
The scientific document saves source, axes, calibration and curves. The numerical Datasets and their Group have a distinct persistence in the Session CORE.
36. Reopening the Curves and Axes
We close the Viewer normally and reopen it from the same Session.
We find the two curves again with 8 and 11 points and the units Y1 mV and Y2 deg. Identifiers, pixels and the shared calibration are unchanged.
37. Reopening Publish and Source
In the Publish tab the plan and the Group checkbox remain.
The Source tab still presents the original image Dataset. For a new publication it is prudent to always check the selection of accepted calibrations too.
38. Verifying the Group After Reopen
In the CORE browser the Group node is still present with its two members.
Rereading through the public APIs confirms COMPLETE, the same Group ID, the same revision and the same fingerprints of the two canonical Datasets.
After reopening the Session, locate the Group in the browser again and use Inspect Group… to reread the status. Check that both members appear, with the roles curve_digitizer.axis.y1 and curve_digitizer.axis.y2, and compare identifiers, revision and fingerprints with those of the publication. This check is different from reopening the Interactive Document: the first verifies the canonical objects, the second the persistence of the Viewer configuration.
39. Reading Y1/Y2 and the Group Through Public APIs
A scientific consumer can query CURVE_DIGITIZER_DATASET_SCHEMA_API_v1 to obtain the identity of the axes and members, avoiding assumptions about column names. The Tcl example requires an open GX-TXT Session and a real published Dataset ID.
# Activate the versioned public Curve Digitalizer Dataset Schema API.
::GX::modulePublicApiActivate viewer.curve_digitizer CURVE_DIGITIZER_DATASET_SCHEMA_API_v1

# Replace this example ID with an actual published Dataset ID.
set datasetId "example.dualy.y1"

# Resolve the scientific axes, curve identities and semantic columns.
set description [::GX::CurveDigitizerDataset::describe $datasetId]
set schema [::GX::CurveDigitizerDataset::read $datasetId]
set axes [dict get $description axes]
set logicalYAxis [dict get $schema columns y_axis_id]

# Read a bounded set of source-linked canonical numeric points.
set samples [::GX::CurveDigitizerDataset::rasterPoints $datasetId "" 0 100]

# Read Group membership through the producer's public adapter.
set grouping [::GX::CurveDigitizerDataset::datasetGroup $datasetId]
if {[dict get $grouping grouped]} {
    set session [::GX::sessionInspectionCurrentSession]
    set groupId [dict get $grouping group_id]
    set groupManifest [::GX::datasetGroupGet $session $groupId]
    set members [dict get $groupManifest members]
}
The describe function includes schema, curves, axes and Group membership; rasterPoints returns data with the original raster coordinates. datasetGroupGet verifies the actual members of the Group from the CORE.
In the script, datasetId must be replaced with the ID of a Dataset actually published in the Session. describe exposes the context of the axes; read allows the column roles to be resolved; rasterPoints consults a limited set of points, keeping their link to the raster. The datasetGroup call makes it possible to establish whether a grouping exists; only in that case does the code consult the manifest through datasetGroupGet. The example shows how to locate the data; it does not perform a fitting.
40. Operating Procedure and Limits
- Import the raster and accept a complete four-corner calibration.
- Enable Y2 and declare the name, unit and limits of both axes.
- Associate each curve with Y1 or Y2 in the New curve / Edit curve dialog.
- Digitize the points and check the identities of the two series.
- With equal units, check the mixed publication and the y_axis_id role.
- With incompatible units, keep the Datasets separate per physical axis.
- Enable Group published Datasets when several standalone results need to be linked.
- Inspect the status, roles, members and canonical SHA-256 values in the CORE.
- Save, close and reopen; check the axes and the persistence of the Group point by point.
- Do not infer accuracy, standard deviation or covariance from grouping alone.
In the case illustrated, the practical decision depends first of all on the Y units: if both curves are in mV, a mixed Dataset with y_axis_id can be used; if Y1 is in mV and Y2 in deg, two Datasets with distinct schemas are needed. The Group is useful only for keeping the link between these publications. Before proceeding, check that the two series keep 8 and 11 points, that the calibration is accepted and that the Dataset Group reports consistent members and status.
The example uses one accepted calibration and no numerical uncertainty declaration. A possible Dual-Y publication with reviewed uncertainties requires further scientific checks and an explicit model, not provided automatically by the Dataset Group.
Conclusion: Dual-Y preserves the meaning and unit of each curve. When the values share the unit, a mixed table can be published; when the units are incompatible, the CORE links two distinct Datasets through a Group without altering their content.