

Dataset Preview — Opening and Interpreting the Ordinary Preview
The Dataset → Preview tab lets you examine the content selected in the GX-TXT framework. It is not the Curve Digitalizer Source tab and is not equivalent to the representation of a published scientific curve. This guide introduces the ordinary view, the case without data and the preview of an image already registered as a Dataset.
The example uses a Session with a synthetic image of 1280 × 900 pixels, containing stylized figures and a drawn scale bar. It is not an experimental micrograph. The names of the GUI controls are given in English.
1. Where to Find Dataset Preview
In the main GX-TXT window choose the Dataset tab, then the Preview sub-tab. The Datasets column on the right lists the available entries and indicates the active Dataset, when present.
The ordinary Preview belongs to the GX-TXT framework: there is no need to open the Curve Digitalizer window to consult it. Do not mistake the Preview for the curve editor, the calibration area or a numerical plot.
2. Opening a Session Without Datasets
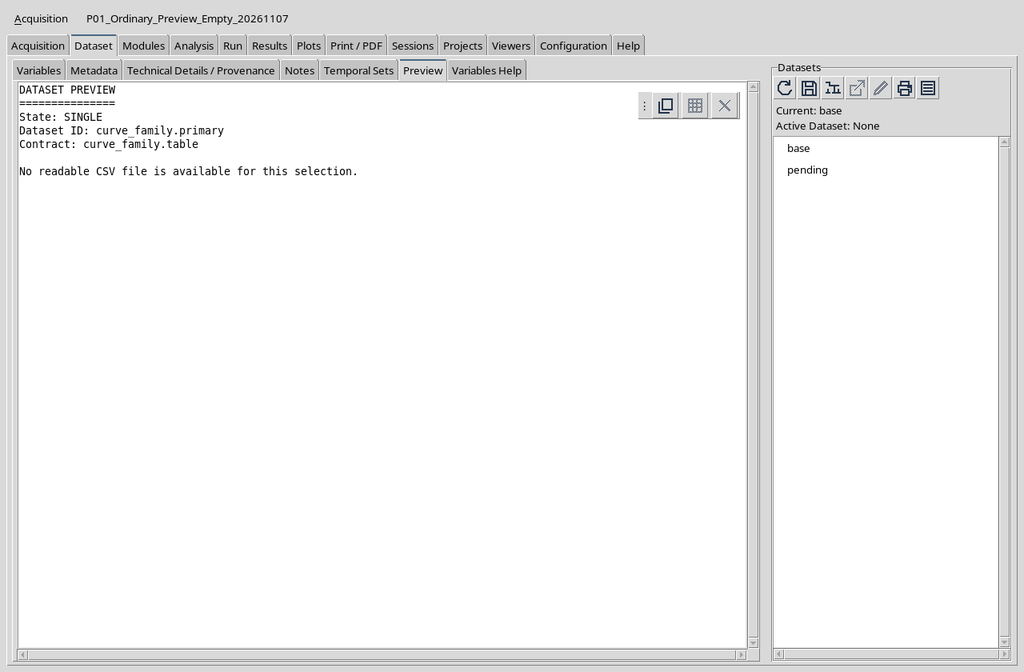
A new Session may have no registered Datasets. Entering Dataset → Preview, the central area then shows a text message, not an image, not a plot and not a table of points.
3. Understanding the State: SINGLE Indicator
On the initial screen State: SINGLE appears: it is the consultation mode for single input, not an acquired numerical result.
Likewise, Dataset ID: curve_family.primary and Contract: curve_family.table identify here the values prepared for the input; they do not prove the existence of a canonical curve Dataset. To establish whether a Dataset has been imported, consult the Datasets list and the actual Session.
4. Interpreting “No readable CSV file is available”
The warning No readable CSV file is available for this selection. means that the current selection does not point to a readable CSV. In a new, empty Session this is an expected condition, not a defect of the Curve Digitalizer.
The solution is not to change the axis of a plot or to press Publish: first a real input must be selected or a relevant Dataset imported.
5. Consulting the Datasets Panel
The browser on the right shows the base namespace, the pending area and any Datasets coming from acquisition modules. When no Dataset is selected, the Active Dataset indicator shows None.
Pending does not mean that a numerical result has already been published. Always check the identifier and type of the Dataset actually present, especially when working with several images and tables in the same Session.
6. Distinguishing an Image Dataset from a Curve
To show a populated case, a single synthetic Dataset of type image.raster was imported through GX-TXT image acquisition. When it is selected, the ordinary Preview represents the original raster.
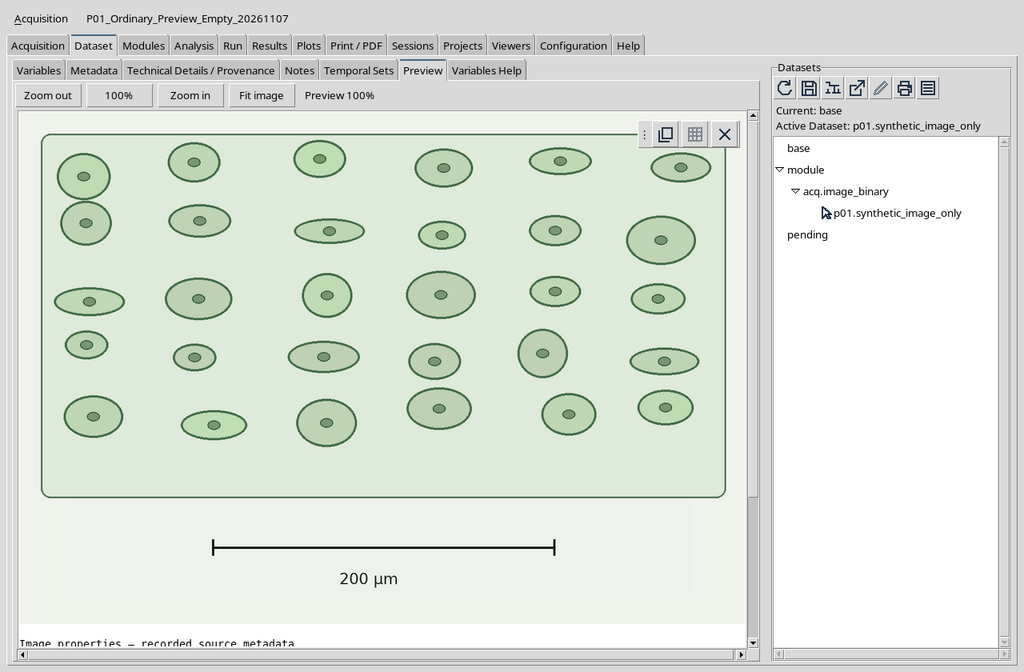
A raster contains pixels and image metadata. A published scientific curve, instead, contains numerical variables, abscissas, ordinates and provenance references. Seeing an image in the Preview does not prove that calibration, digitization or publication of the curves has taken place.
7. The Imported Choice
When the Session contains a registered Dataset, the system makes it available for consultation as an Imported selection. In the example the only additional ID is p01.synthetic_image_only.
The identifier is a reference to the Dataset present in the Session; it must not be confused with the name of an arbitrary file, or with the name of a curve in the Viewer. The original content remains distinct from its preview representation.
8. Four Display Controls
When a compatible image is shown, Zoom out, 100%, Zoom in and Fit image appear. They serve to change the view of the raster on screen. The percentage shown next to the buttons describes the display magnification.
Zooming does not perform a scientific calibration, does not assign the µm unit to the pixels and does not rewrite the canonical Dataset. The 200 µm bar shown in the raster is only an element of the teaching image.
9. Using Zoom In
Pressing Zoom in from Preview 100%, the view switches to Preview 200%. A portion of the raster appears larger and navigation requires the scroll bars.
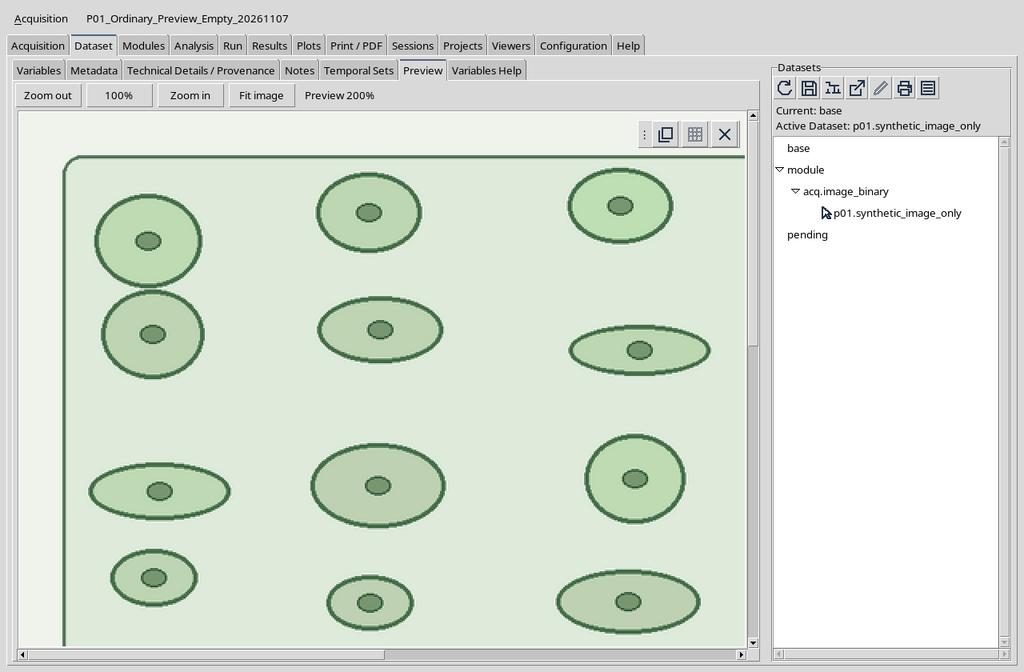
This magnification changes only the graphical rendering. To digitize coordinates precisely, the source and the calibration in the Curve Digitalizer are needed, covered in the previous chapters.
10. Fitting with Fit Image
Fit image resizes the view to fit the visible area. In the example the switch from 200% to Fit produced Preview 50%.
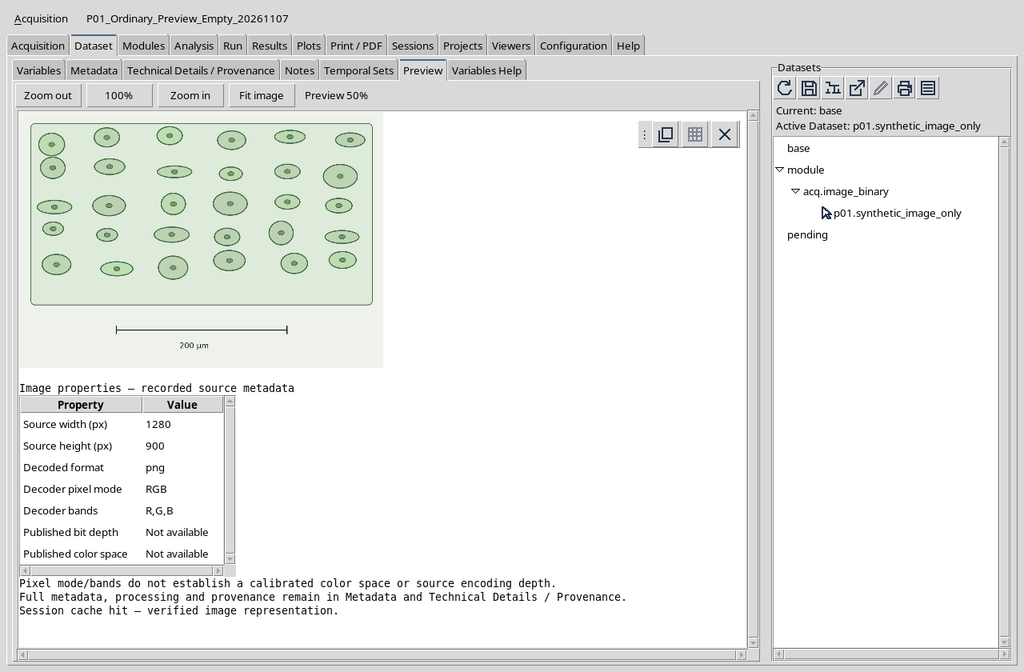
The actual percentage depends on the available surface: it is neither a scientific parameter of the Session nor a new sampling of the registered data.
11. Restoring 100%
Pressing 100% returns to the display at the nominal pixel scale. In the case illustrated the value returns from Preview 50% to Preview 100%.
The change is reversible and does not generate another Dataset. The scroll bars let you reach the portion of the image that does not fit in the window.
The visual result at 100% coincides with the initial view of the raster already shown: for this reason no new screenshot is needed. The command acts on the presentation; the original resolution of 1280 × 900 pixels does not change.
12. Scrolling and the Visible Area
When the raster is larger than the frame, use the vertical and horizontal bars to see different regions. Moving the display window does not physically move the elements in the original image.
For analyses and measurements use the coordinates of the source raster. A position on the screen changes as the zoom varies, while the identity of the Dataset and its pixels remain unchanged.
13. Reading the Image Properties
Scrolling below the image, GX-TXT presents Image properties — recorded source metadata. In the case reproduced, the width is 1280 px, the height 900 px, the format png, the decoded mode RGB and the bands R,G,B.
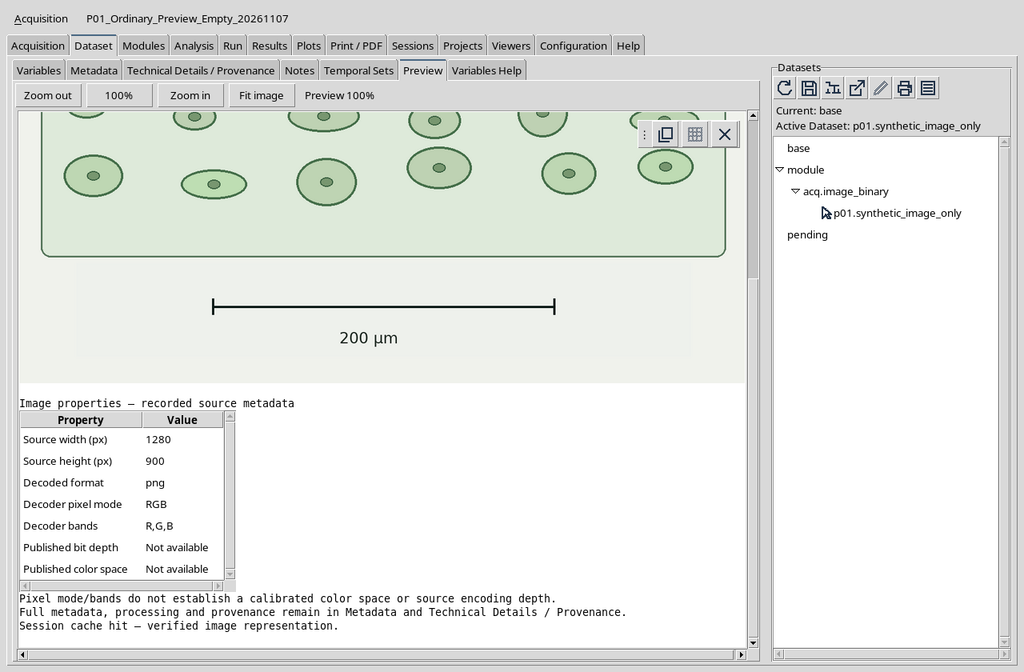
These data describe the available representation and do not by themselves indicate a physical measurement. The graphical bar and the units must be interpreted with respect to the documentation of the source and the actual calibration.
14. Do Not Infer Missing Properties
In the test panel Published bit depth and Published color space are shown as Not available. The RGB mode returned by the decoder does not automatically certify either the original sample depth or a calibrated colour space.
When the property is not declared, the guide does not assign it a hypothetical value. For further details use Metadata and Technical Details / Provenance.
15. The Preview Can Prepare and Use a Cache
After selecting an image, the GUI may temporarily show Preparing a persistent image Preview asynchronously…. Afterwards Session cache hit — verified image representation was observed.
The cache message indicates that the available representation can be reused. It does not prove that the raster has been modified and is not equivalent to a tracing or fitting result.
16. The Empty State Can Depend on the Selection
Even after importing a raster, returning to the Single-file input entry without indicating a readable CSV brings back the initial message. The imported Dataset, however, remains visible in the Session browser.
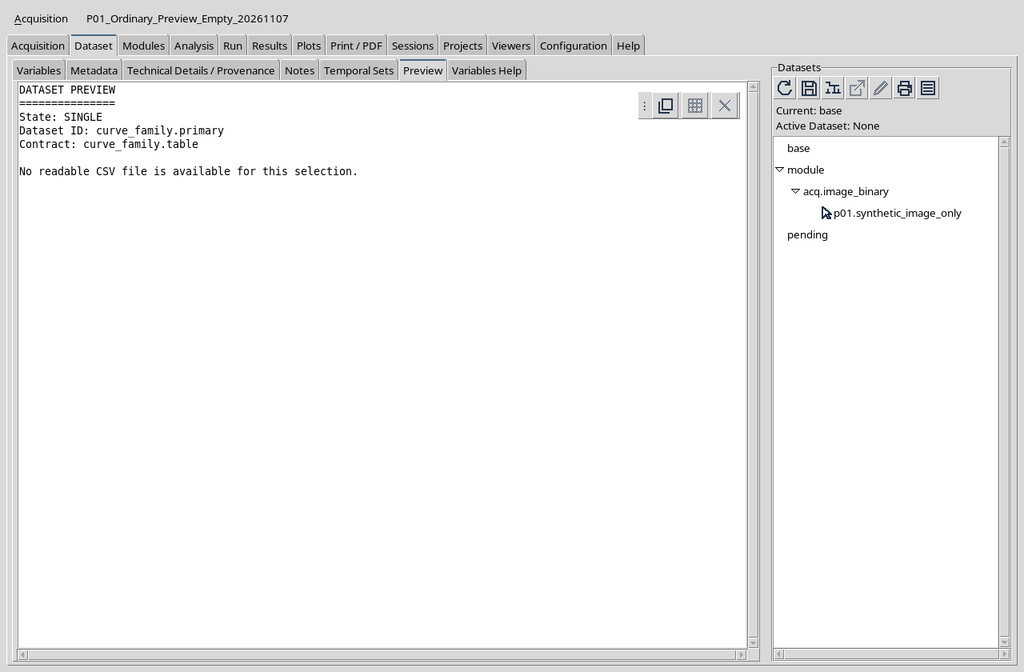
This distinction is important: absence of data in the current selection does not necessarily mean absence of all Datasets in the Session.
17. Reselecting the Imported Dataset
To return to the image, select the imported Dataset again. The Preview shows the same raster again and, in the verified case, reuses the Session representation.
If the image does not appear, check that the correct Session is open and that the chosen Dataset is still present. Do not replace a calibrated source with another image just to get around a consultation problem.
Reselecting the Image Dataset restores the same image already shown in the first preview. The check consists of verifying that the selected ID and the raster coincide with those imported: reselection does not import another copy and does not publish new curves.
18. The Variables Sub-Tab Is Not a Plot
Next to Preview there are Variables, Metadata, Technical Details / Provenance, Notes, Temporal Sets and Variables Help. The Variables tab manages variable information; with the raster used here it does not show a numerical table of already published curves.
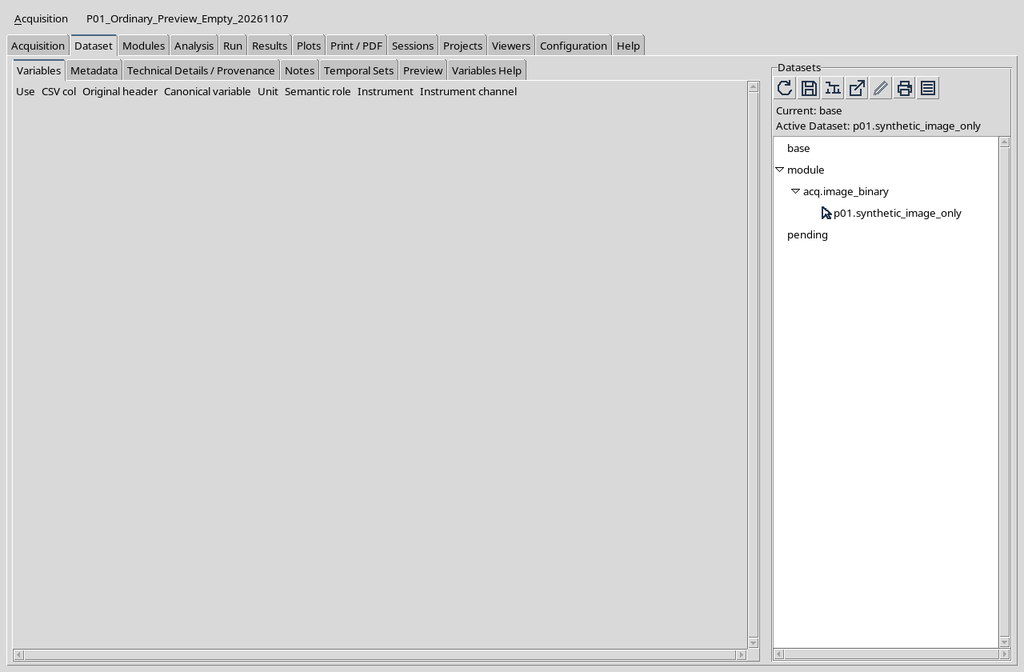
Do not interpret visible headers or empty fields as a validation of the numerical content of a non-existent Dataset.
19. Provenance Is Not a Graphical Result
Consulting Metadata and Technical Details / Provenance serves to reconstruct the declared properties and the provenance of the data. The graphical Preview of the source does not replace these checks.
The practice image shows a drawn bar, but it does not prove metrological precision, actual calibration or measurement uncertainty. This information cannot be automatically attributed to the source file.
20. Difference from the Curve Digitalizer Contribution
The Curve Digitalizer Dataset Preview module is an additional contribution to the CORE Preview. Its Curves, Calibration & Quality and Canonical Data tabs are designed for consulting numerical Datasets published by the Digitalizer, not for directly transforming a raster preview into a scientific plot.
These tabs and their controls will be covered separately, starting from chapter P02. The case verified here contains only an image.raster source: no published curve, no Plot v4 and no table of scientific points.
21. Final Check Before Proceeding
To distinguish the cases correctly, check which Session is open, which Dataset is selected, what type the Dataset is and which representation is shown. A selection without CSV explains the empty panel; an imported raster explains the image; a canonical curve table requires an actual previous publication.
The ordinary Preview is a consultation tool. Never confuse the zoom percentage, the default identifier of an input or a drawn scale bar with an already validated scientific measurement.