

Assisted Tracing: Guides, Corridors and Proposal Review
Curve Digitalizer can produce a candidate path along a raster curve. The guides are placed by the operator on the image; Corridor (px) sets how far the tracer may explore the neighboring pixels. Propose generates a provisional trajectory, which becomes a scientific series only after explicit acceptance. The guide focuses on building and inspecting proposals: in all the tests described, the scientific series stays empty.
1. The Original Graph to Digitize
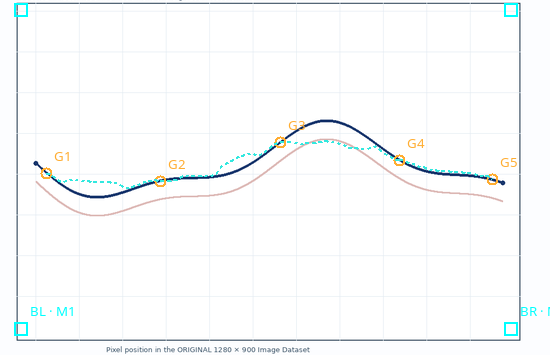
The exercise uses a synthetic raster of 1280 × 900 pixels: a continuous blue line, a competing pink line shifted downward and a faint grid. The blue curve was built from a known mathematical function; this allows an independent quantitative comparison.
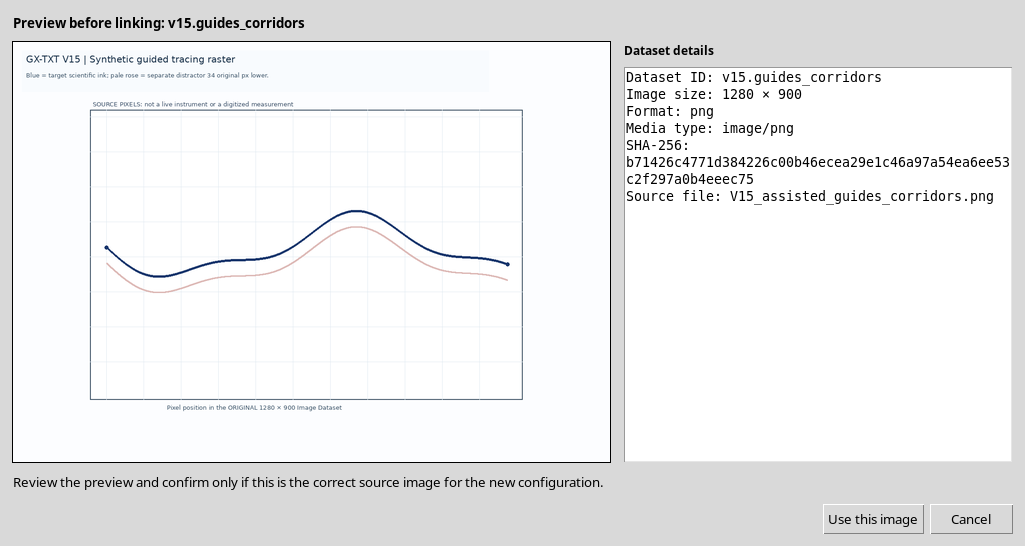
This graph is not an instrument measurement. Its purpose is to make clear how the results change with guides and corridors, without confusing the geometric deviations of the raster with physical uncertainties.
2. Selecting the Image Dataset
To use a raster in the framework, it is imported as a canonical image.raster Dataset. The Dataset appears in the Image Dataset selector; you can check its preview and choose Use this image.
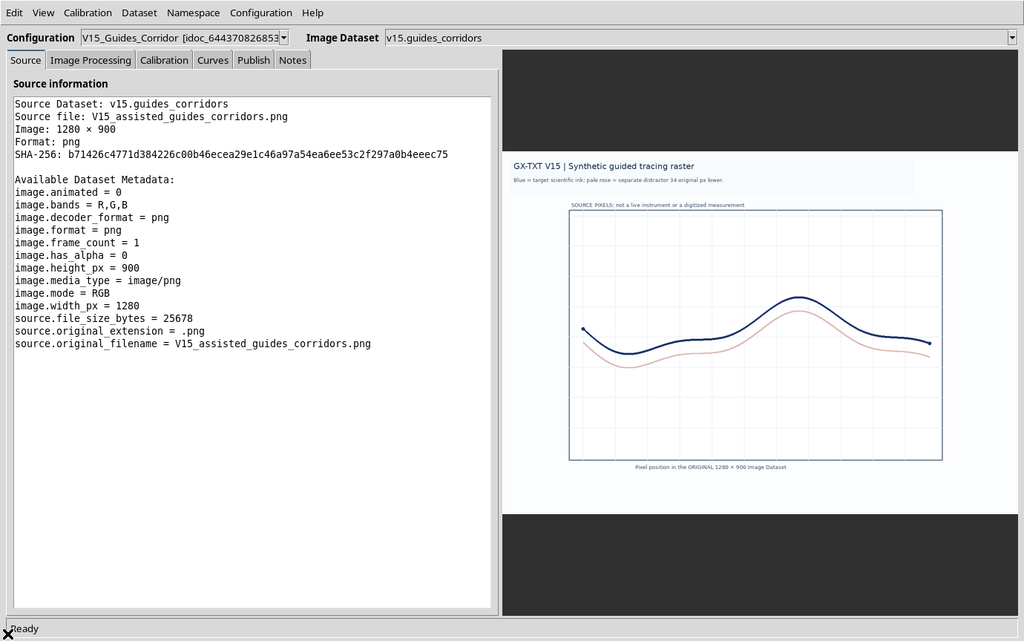
Selecting it shows the image on the Canvas, but does not create numerical points or a curve Dataset.
3. Four-Point Calibration
In the Calibration tab, the corners BL, BR, TL and TR are set. The example uses X Elapsed time from 0 to 10 s and Y Detector response from −20 to 80 mV, both linear. The complete calibration measurement is confirmed with Accept in the calibration measurements section.
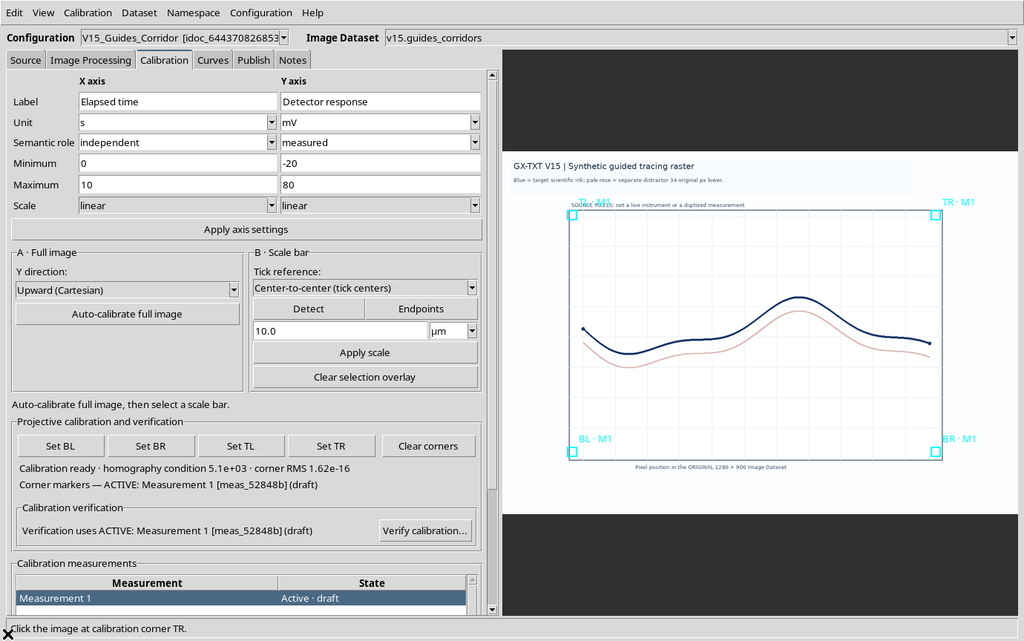
Calibrating the image means defining the conversion from original pixels to scientific coordinates. It does not automatically determine which of the different colored traces is to be followed.
4. An Initially Empty Target Curve
Switching to the Curves tab, the New curve command creates a series named Blue synthetic trace.
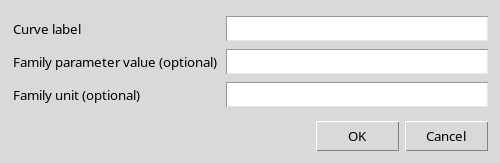
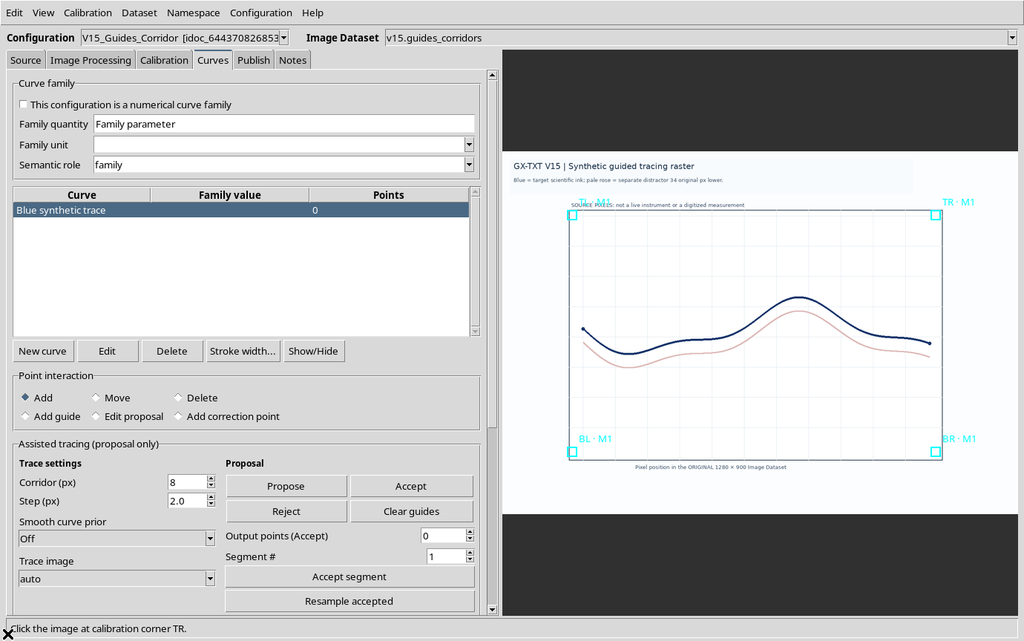
The series initially contains 0 points. This number is an important reference: a tracing proposal must not be mistaken for points already inserted.
5. Finding the Assisted Tracing Panel
The same Curves tab contains Point interaction, with the Add, Move, Delete, Add guide, Edit proposal and Add correction point modes. Just below is Assisted tracing (proposal only).
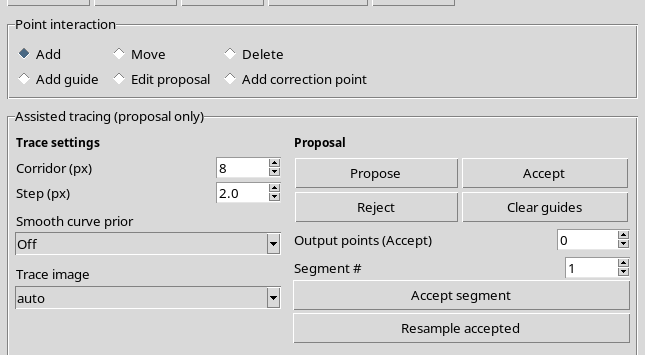
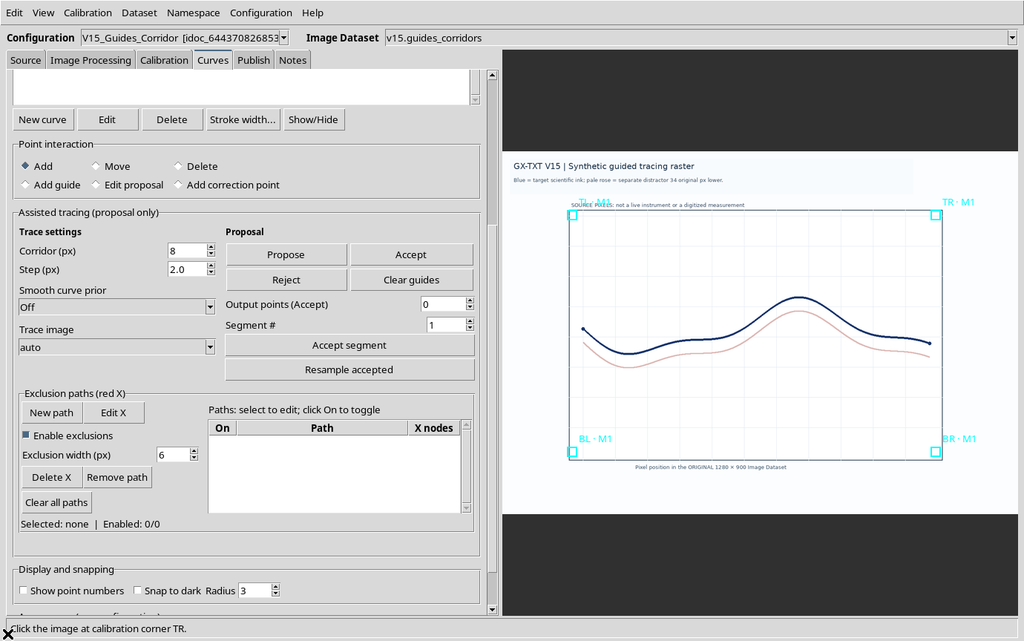
The main parameters are Corridor (px), Step (px), Smooth curve prior and Trace image; the actions are Propose, Accept, Reject and Clear guides. To isolate the effect of the corridor, Step = 8 px, Smooth curve prior = Off and Trace image = auto stay fixed here. Step, regularization and excluded regions will have dedicated checks.
6. Placing the First Guide
Select Add guide and click a significant point of the blue trace. The GUI draws an orange reference G1 over the image.
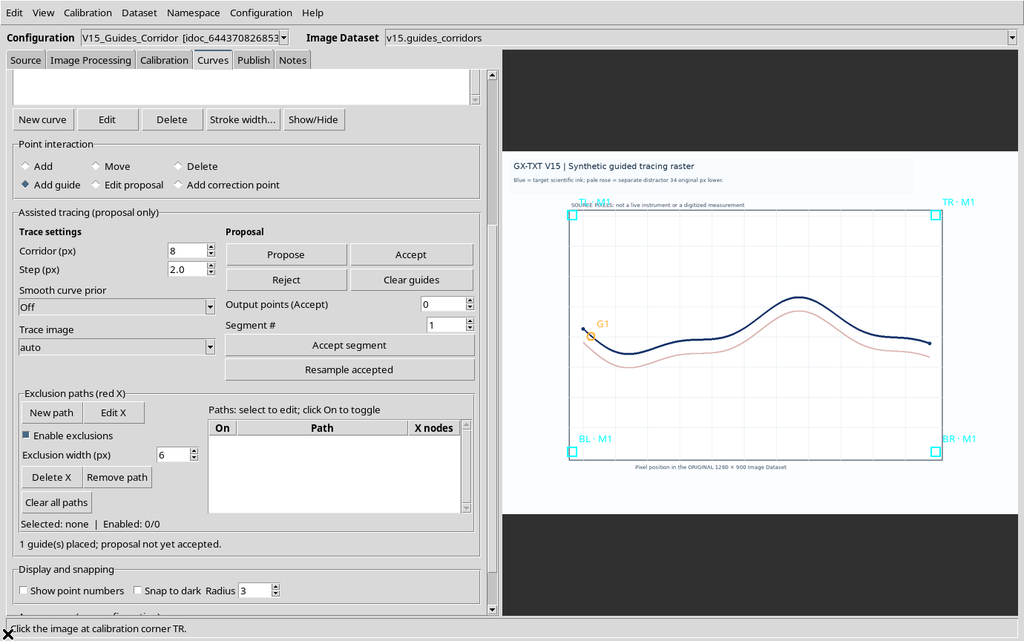
The guide tells the algorithm which stretch to follow, but it is not a measurement saved in the scientific series. Placing guides is not the same as using Add to add numerical points.
7. A Single Guide Is Not Enough
If you press Propose after placing only G1, the message Place at least two guide points on the image. appears.
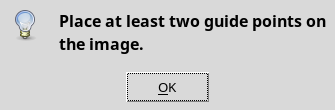
At least two endpoints are needed to identify a search interval. No new curve or point is produced when the second reference is missing.
8. Two Guides with a Four-Pixel Corridor
Place G2 on the trace, set Corridor (px) = 4 and keep Step = 8.
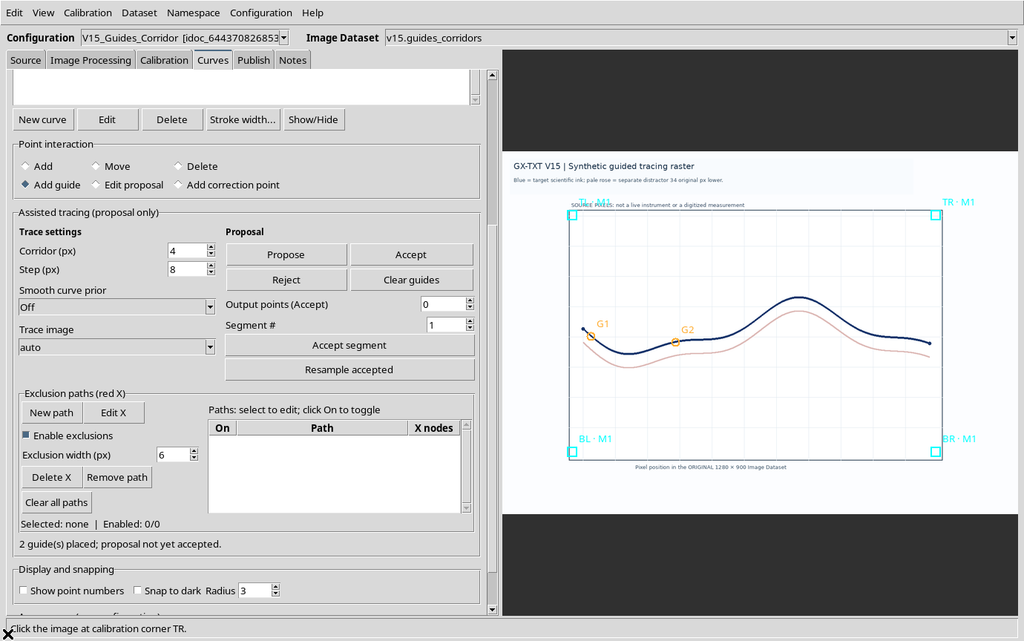
These quantities are expressed in pixels of the source image, not in screen pixels: zooming the Canvas does not multiply the scientific search radius.
9. The First Tracing Proposal
Pressing Propose with two guides, the Viewer produced a path of 28 proposed points in one segment.
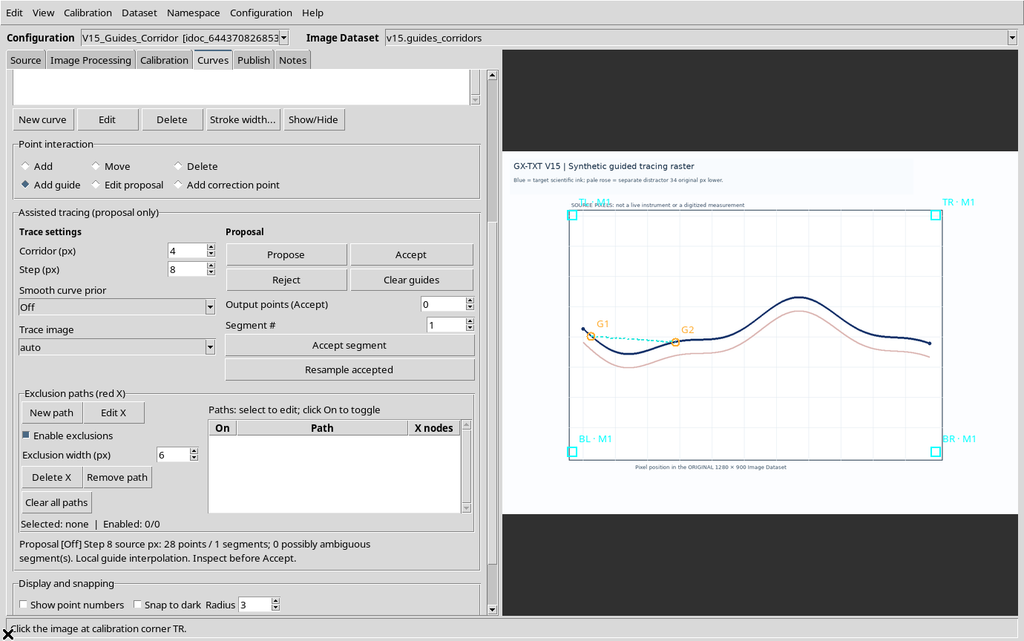
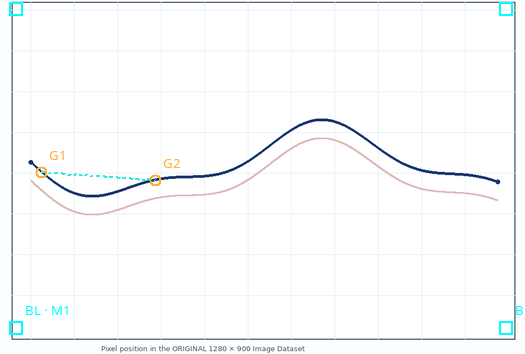
The cyan line is the candidate. The numerical series still contains 0 points until an explicit acceptance command is issued.
10. Adding Another Guide Invalidates the Previous Candidate
G3 is inserted with Add guide. The Viewer keeps the guides and removes the previous proposal, because the path no longer matches the current set of constraints.
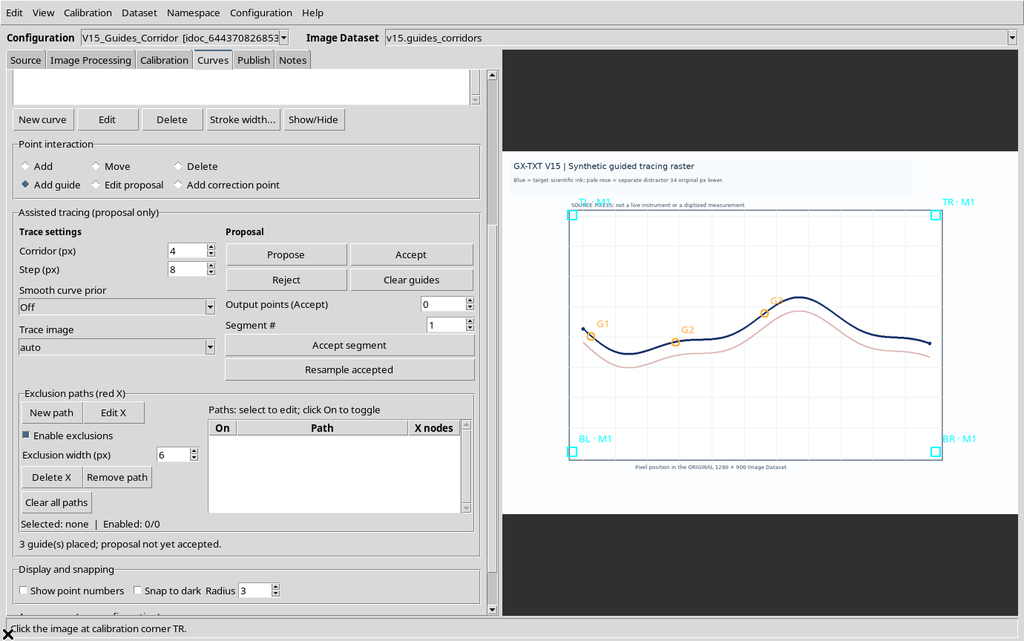
This behavior protects against displaying an outdated proposal when the geometry of the guides changes.
11. Five Guides for a Non-Straight Curve
G1–G5 are completed along the blue line, without selecting the pink trace.
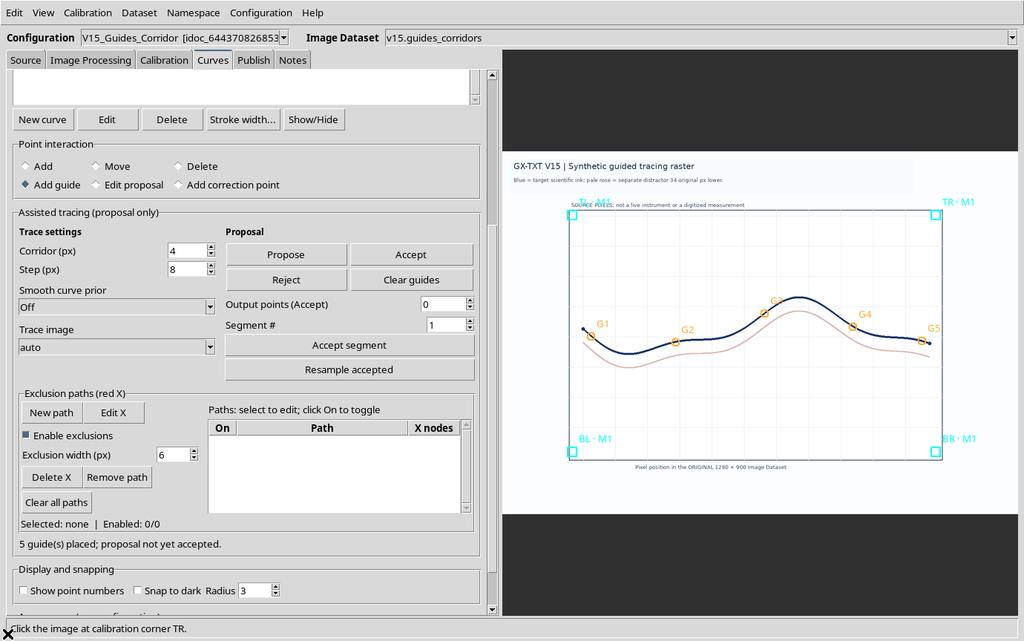
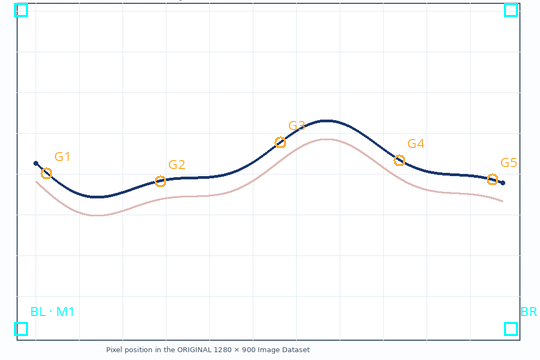
Five guides create four intervals between consecutive guides. Adding points in the areas where the slope changes can make the reference path more informative; the search between the guides still has to be checked.
12. Computing the New Proposal
On longer intervals the Viewer may asynchronously request an optional numerical interpolation from the framework. During this phase Generating a new … tracing proposal appears.
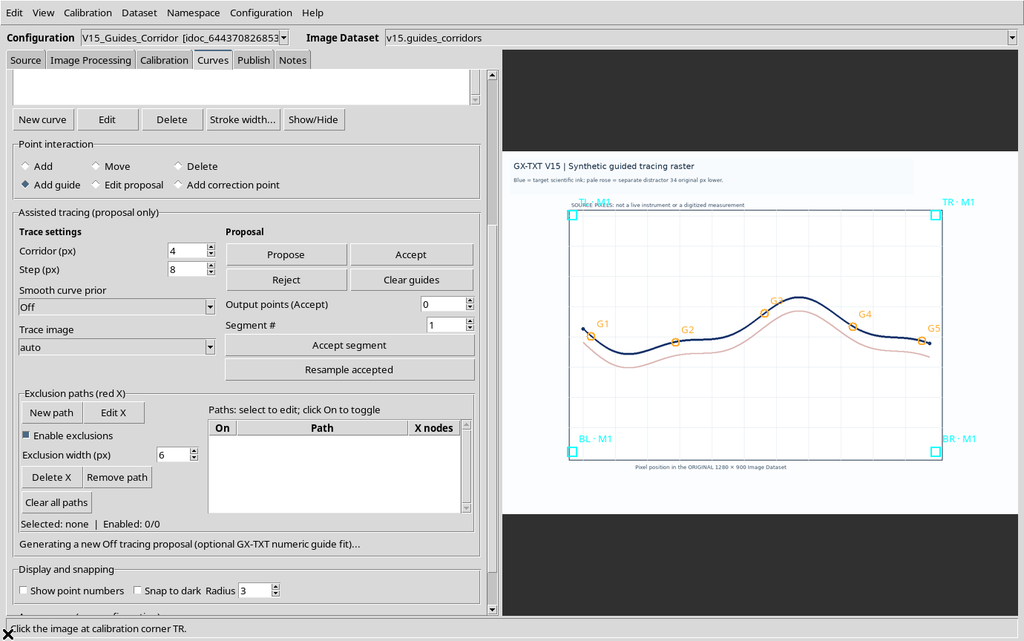
This is a temporary state: the summary that follows completion must be read before evaluating the result. The algorithm does not insert scientific points into the series at this stage.
13. Five Guides and Corridor Equal to Four Pixels
With five guides, Step = 8, Corridor = 4, regularization Off, the actual GUI summary is 108 points / 4 segments.
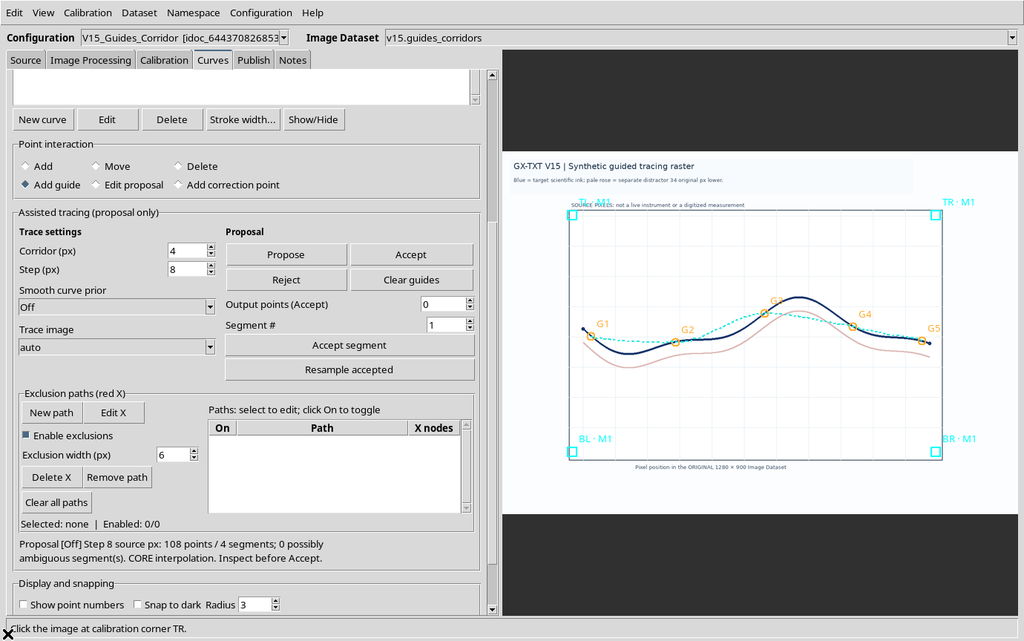
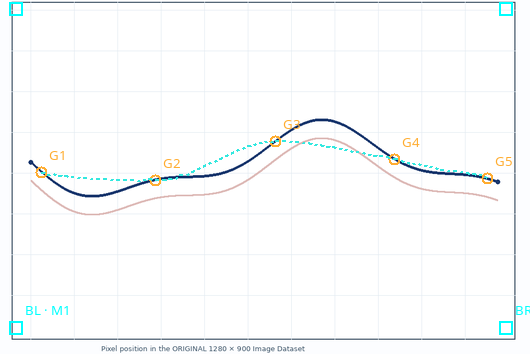
A trajectory can pass through the guides correctly but drift away from the blue line in the intermediate intervals. This is why a numerically dense proposal is not necessarily an accurate curve.
14. The Meaning of the Corridor Parameter
Corridor (px) limits the exploration of pixels around the interpolated reference. A small value can exclude real stretches of the curve; a large value can lead the tracer towards competing lines, labels, axes or grids.
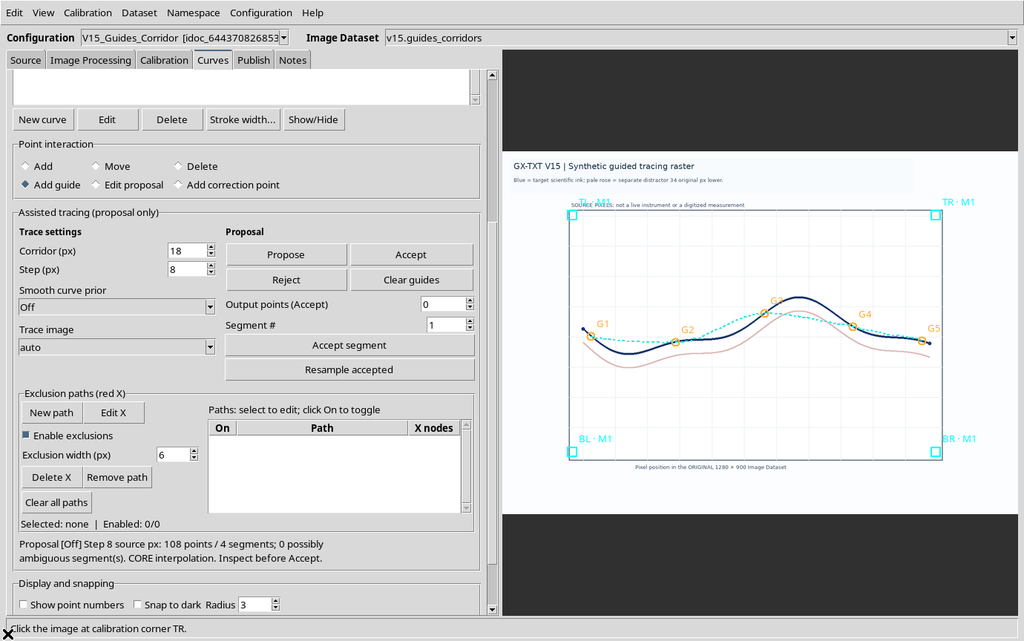
Changing the spinbox does not automatically compute a new proposal: after the change you need to press Propose.
15. Repeating the Calculation with Corridor Equal to Eighteen Pixels
With the same five guides, Step 8, regularization Off and Corridor = 18, the Viewer again generates 108 points spread over four segments.
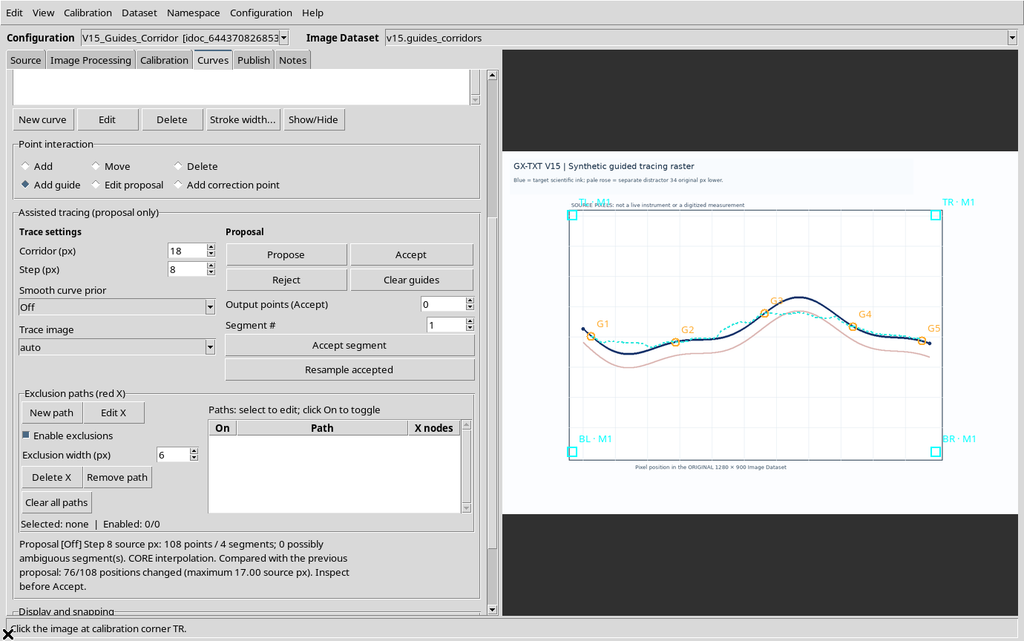
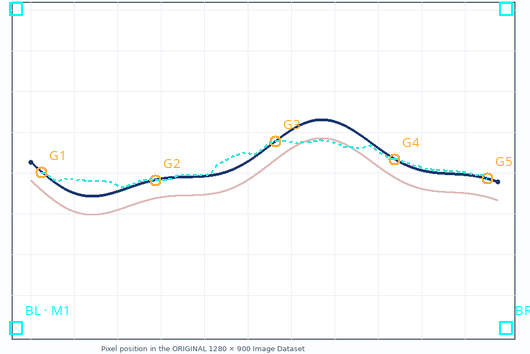
The GUI also quantifies the change compared with the previous proposal: 76/108 positions changed, with a maximum of 17.00 source px.

The figure confirms that the width of the corridor really changes the candidate. It does not prove that the wider path correctly follows every part of the curve.
16. Measuring the Deviations from the Known Trajectory
The synthetic blue curve is described, in original pixel coordinates, by:
y(x) = 440 + 58 sin(2π(x − 200)/720) + 20 sin(2π(x − 200)/305).
Comparing the vertices shown by the GUI on the Canvas (mapped back to the grid of original pixels) with the reference function gives:
| Geometric quantity | Corridor 4 px | Corridor 18 px |
|---|---|---|
| Candidate points | 108 | 108 |
| Segments | 4 | 4 |
| Mean absolute deviation | 18.16 px | 13.36 px |
| Root mean square deviation (RMSE) | 22.85 px | 17.89 px |
| Maximum absolute deviation | 47.99 px | 38.13 px |
In this case the wider corridor reduces the deviations from the blue curve; however, the result remains far from an accurate reconstruction. These deviations are neither metrological uncertainties nor an estimate of scientific confidence: they only describe the two candidate trajectories obtained on this synthetic raster.
17. The Allowed Limits for the Corridor
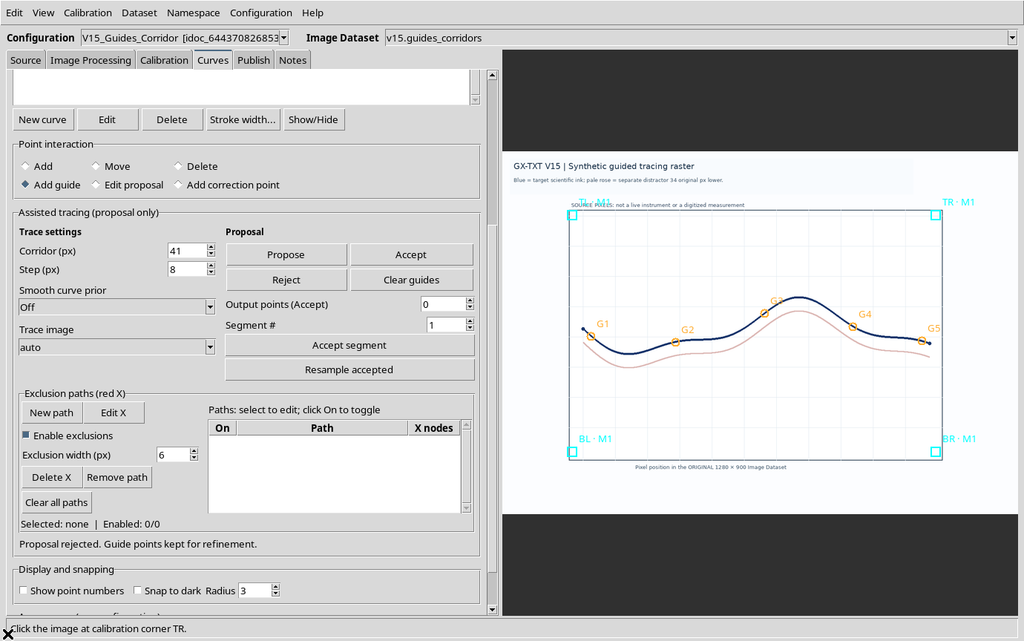
The Viewer requires Corridor between 1 and 40 original pixels. When 0 is entered manually and Propose is pressed, Corridor must be between 1 and 40 original-image pixels. appears.
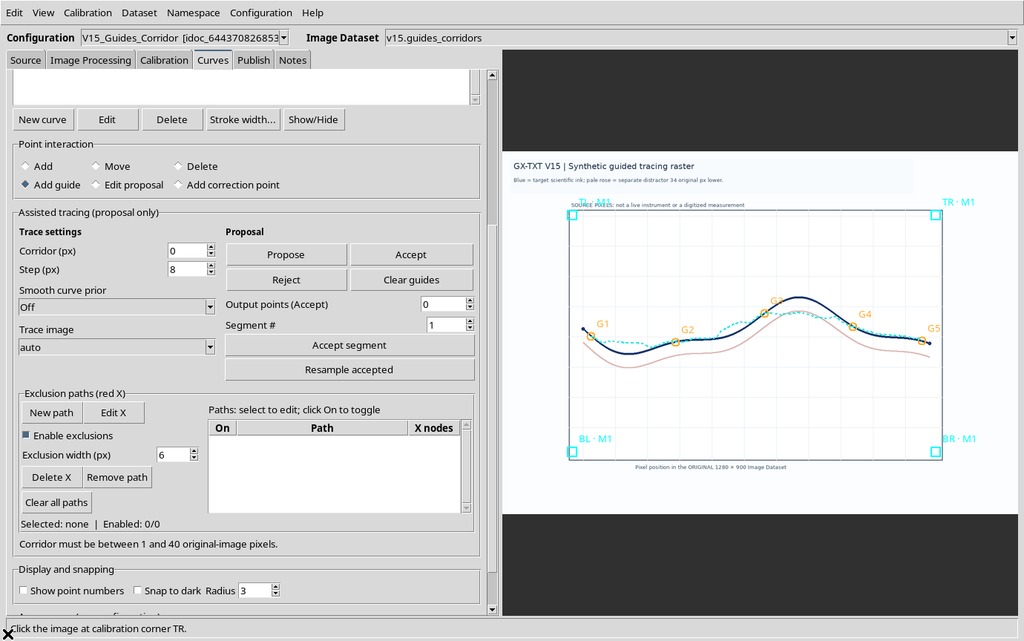
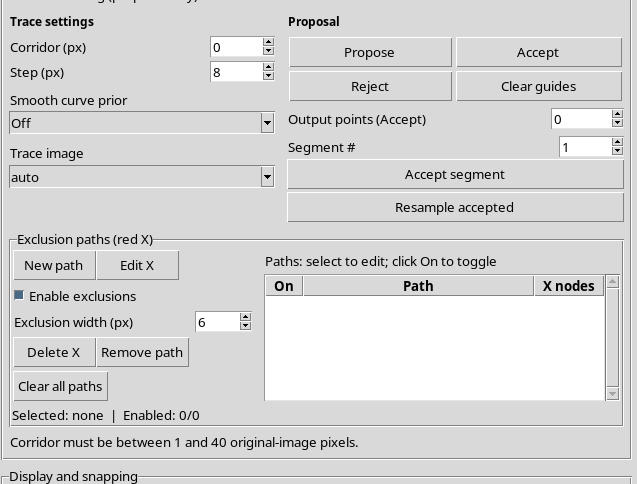
The out-of-range value is rejected and does not generate a new valid proposal.
18. A Leftover Overlay After the Error
The current version has a display problem. After a valid proposal has been generated, requesting Propose with Corridor = 0 or 41 produces the correct error, but can leave the previous cyan line on the Canvas.
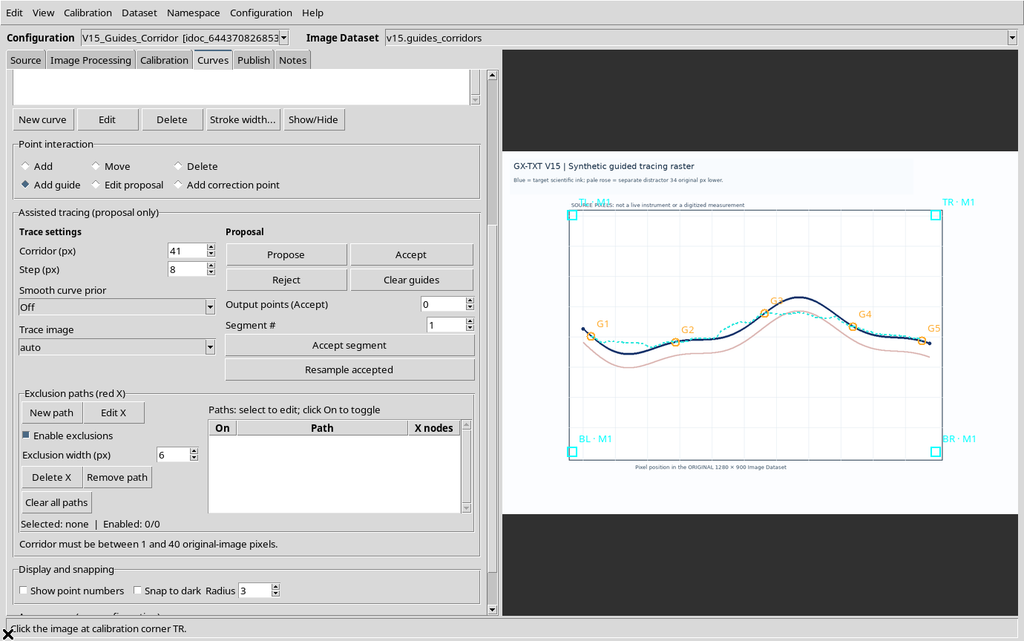
The leftover line does not represent a new valid proposal with the parameters just entered. This is a display refresh problem, not a change to the scientific points. Press Reject to remove it before setting a valid corridor again.
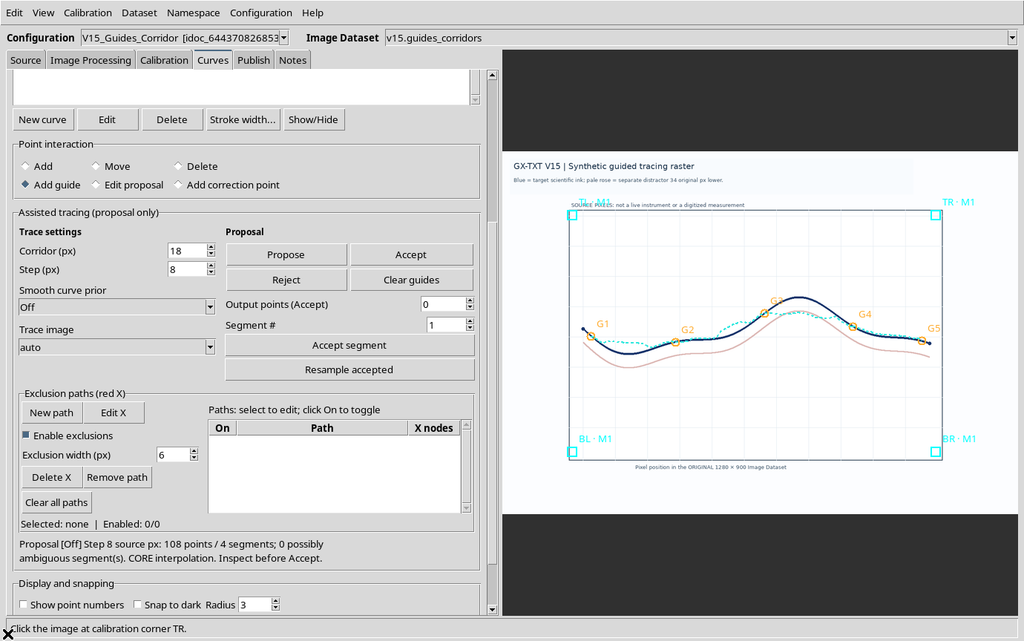
19. Reject Removes the Outdated Line but Keeps the Guides
Pressing Reject after the error removes the candidate line and leaves the five guides G1–G5.
This makes it possible to correct the parameter and start again from a new proposal, without having to re-enter the references. It is not an operation that deletes the scientific points of the series.
20. Restoring a Valid Value and Repeating Propose
Setting Corridor = 18 again and using Propose once more, the program generates a regular proposal of 108 points over four segments.
After every new proposal, check the message with the number of points and inspect the overlay on the original raster.
21. Reject on a Proposal Without Errors
Reject also discards a regularly generated candidate, without deleting the guides.
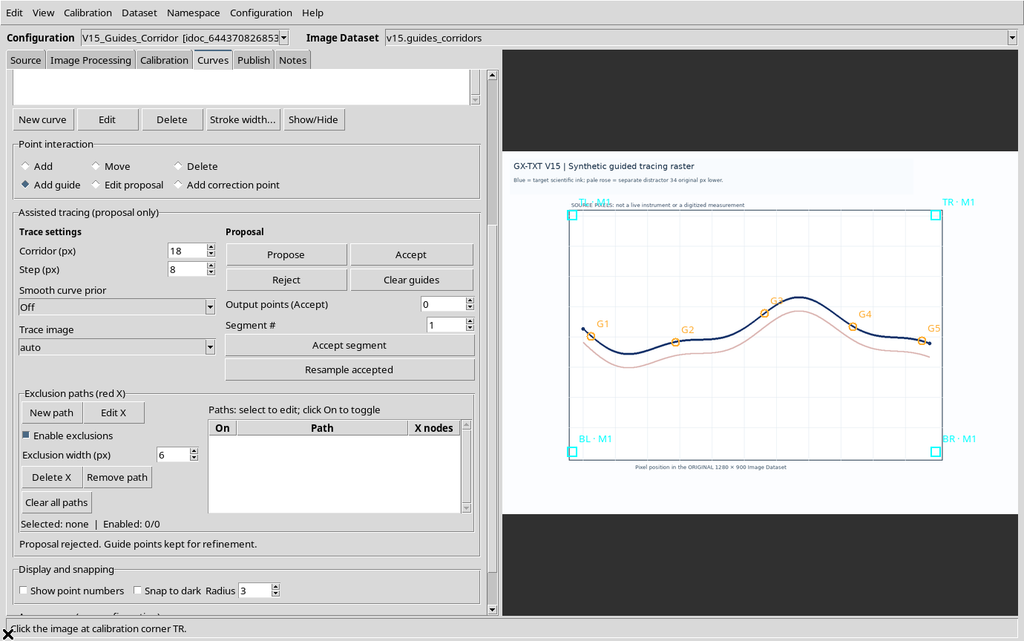
This way different parameters can be compared before adopting a final tracing. A provisional path is useful for review, but must not be considered acquired data.
22. Clear Guides Deletes the Provisional Constraints
Clear guides removes the guides and the proposal, leaving the image Dataset, the calibration and the numerical series intact.
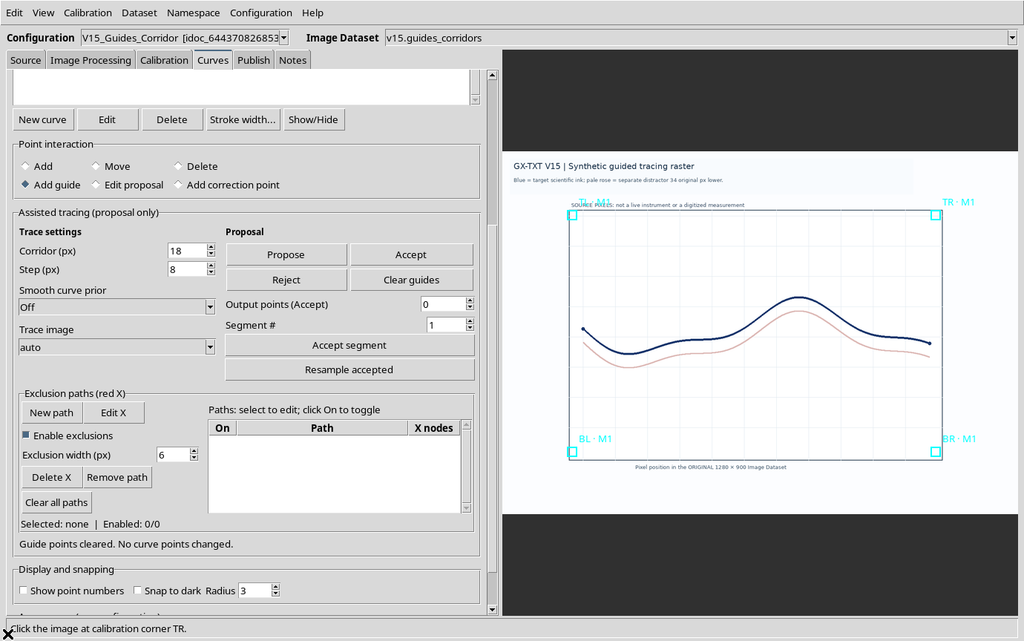
This separation between guide, proposal and scientific point avoids interpreting a graphic operation as the deletion of already accepted measurements.
23. Saving and Reopening in the Same Session
After Save configuration, closing and reopening in the same Session, the image Dataset, the calibration and the curve with zero points are still present. The guides and the proposals, instead, are not restored.
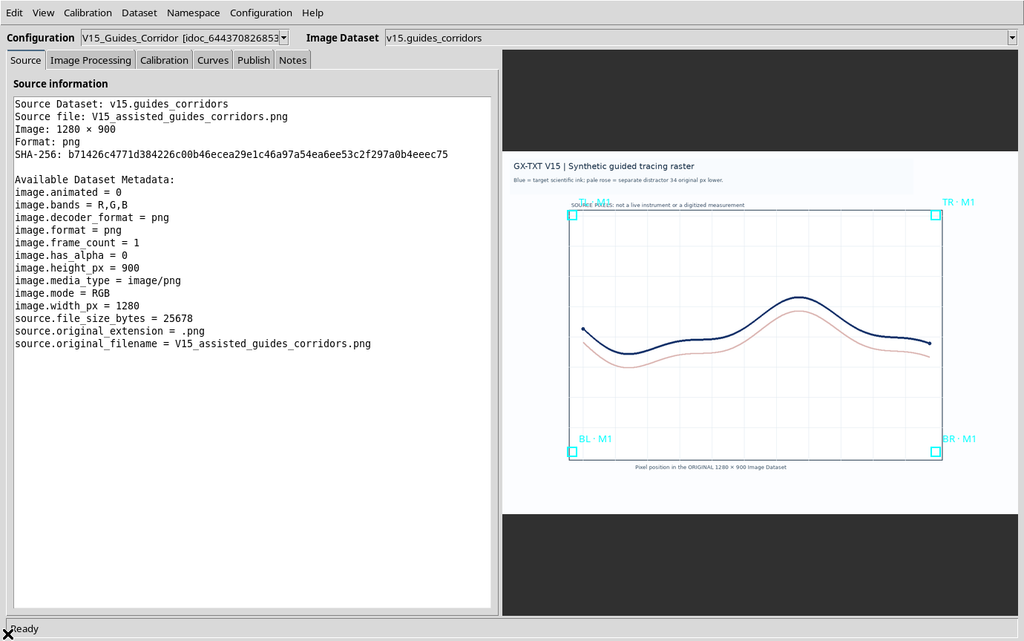
The temporary values of the panel also return to Corridor = 8 and Step = 2.0 on this reopening. If you want to rebuild a proposal you need to place the guides again and check the settings.
24. How to Choose Where to Place the Guides
It is advisable to place guides in areas of strong curvature, near lines that cross and where the desired color is hard to distinguish. A very long interval between two guides can allow several paths; a narrow corridor may not include the real curve. A badly placed guide, on the other hand, can force the candidate through the wrong stretch.
It is therefore best to start from a few checkable references, inspect the proposal and add guides only where they are needed. The density of the candidate points does not replace visual validation.
25. Functions Deliberately Deferred
This example does not run Accept, Accept segment or the publication of numerical Datasets: none of the 108 candidate points enters the scientific series. The Step, monotonicity, smoothing, excluded paths, segment review and acceptance, uncertainty and Dataset Preview functions are illustrated in the dedicated chapters.
26. Essential Procedure
Operating sequence: image Dataset → calibration → New curve → Add guide (at least two guides) → Corridor (px) → Propose → check on the raster. After a corridor error, use Reject to remove any old line before repeating the search.