

Handling errors, Stop and Pause in the Octave Debugger
In the native GNU Octave Debugger, a Job can finish correctly, stop because of a script error or be cancelled by the user. These are different situations: PAUSED means the program is stopped and can move forward; FAILED indicates a failed execution; CANCELLED indicates the interruption requested with Stop.
This guide shows the behavior of the three conditions in GX-TXT Octave Script Workspace 1.8.3, using the interface of the DEV112-P005 distribution. The screenshots reproduce the actual application: High Contrast Dark editor, Tk/ttk controls and panes with native colors.
1. Preparing an Example That Produces a Controlled Error
Open Octave Script Workspace with an active Session. Select File → New Script and save the following source with File → Save, assigning it a Session identifier. It is a teaching example: it does not access instruments, Datasets or input files.
% Synthetic Octave error for learning the managed native debugger.
1; % Permit local functions in an executable Octave script.
function value = calibration_probe(sample)
  calibration_gain = 2.5;
  preliminary = sample * calibration_gain;
  evidence_vector = [sample, preliminary, 7];
  error('O23_SYNTHETIC_ERROR: deliberately invalid reference');
  value = preliminary;
endfunction
input_value = 4;
result = calibration_probe(input_value);
fprintf('O23_UNEXPECTED_SUCCESS=%g\n', result);
The calibration_probe function prepares some values and then explicitly calls error. This statement generates a GNU Octave error condition, with an identifiable message. The product preliminary equals 10, but the value = preliminary statement is not reached in the execution that continues past the error.
2. Setting the Breakpoint and Distinguishing Pause from Stop
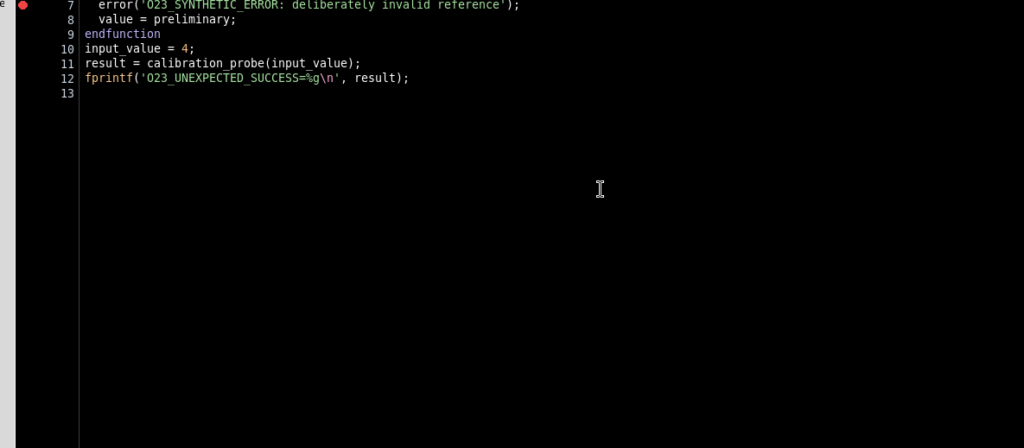
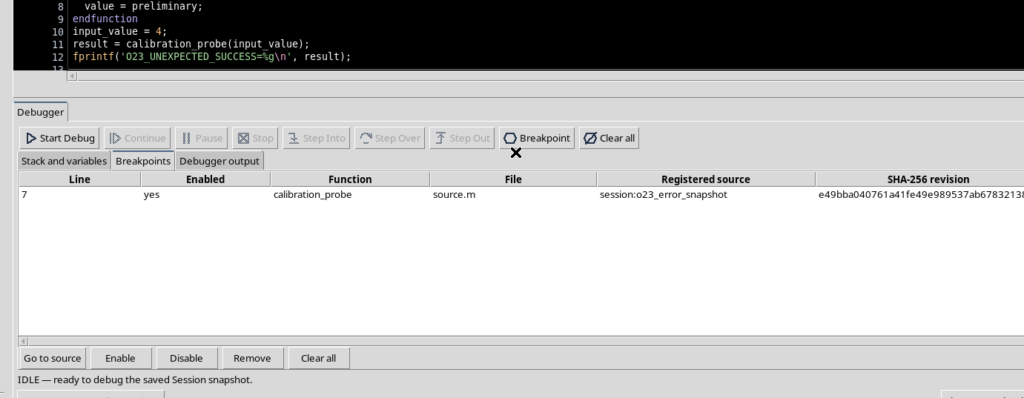
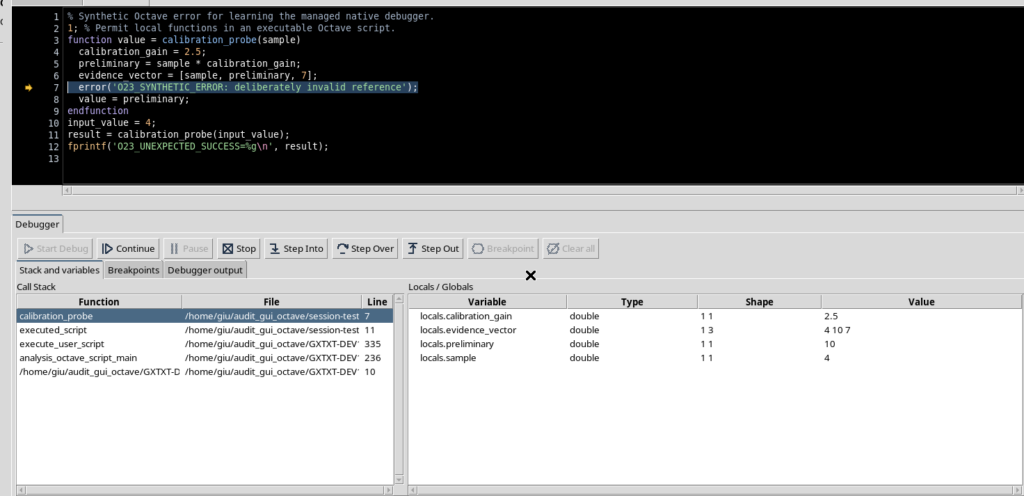
Place the cursor on line 7, containing error(…), and press F9 to insert the breakpoint. Open Run → Debug Session script…. The Breakpoints tab lets you check the stop point before starting the Job; the Start Debug button starts the revision of the script saved in the Session.
In the Octave debugger of this version, Pause is not available as an asynchronous suspension. The control is disabled and the associated information explains that the CLI adapter does not offer a verified asynchronous pause. To examine the code you use breakpoints and Step commands instead; to stop a Job for good you use Stop.
3. Stopping Before the Error and Reading the Variables
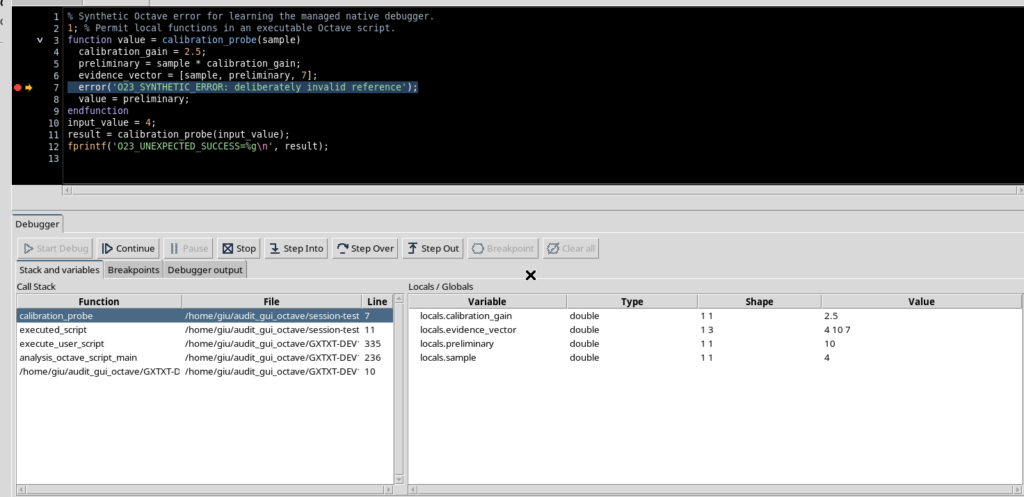
Press Start Debug. Execution reaches the breakpoint at line 7 and stops in the PAUSED state. The arrow in the source margin marks the position where the interpreter is actually suspended.
Open View → Call Stack and View → Variables / Locals, then the Stack and variables tab. Here the variables observed before the error include sample = 4, calibration_gain = 2.5, preliminary = 10 and evidence_vector = [4, 10, 7]. The pane shows type, dimensions and a summary of the values: it is not an interactive expression interpreter.
4. What Happens If You Edit the Source During PAUSED
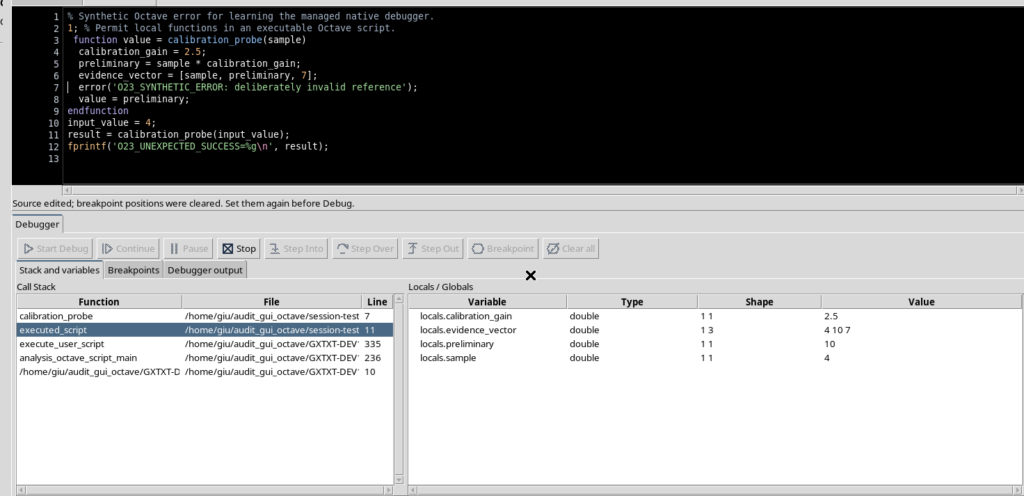
The Job is associated with an immutable revision of the saved source. Changing the editor content in the meantime does not change the code of the Job already started. When the editor contains unsaved differences from the executed revision, Continue, Step Into, Step Over and Step Out are disabled, to avoid attributing the execution to lines that no longer match.
This constraint applies even to a small text change. Stop remains available, because cancelling the Job does not require the buffer to match the executed snapshot.
5. Restoring the Source and Recovering the Commands
Undo the change made in the buffer, bringing the text back exactly to the saved version. When the source is clean again and matches the Job revision, the stepping controls become available again.
A change to the source can invalidate the breakpoints set on the old positions. Before starting a new Job, always check that the desired markers are still present and, if necessary, recreate them with F9. Restoring the buffer without a new save does not automatically create a new Registry revision.
6. Executing the error Statement and Recognizing FAILED
With the Job still PAUSED on line 7, press Continue. GNU Octave executes the error(…) call. The Job ends in FAILED; this is neither a breakpoint nor a normal completion.
The debugger keeps the message O23_SYNTHETIC_ERROR: deliberately invalid reference and the actual origin of the error: calibration_probe, line 7. The exception trace remains visible in the Call Stack, including the calling script. The variables are labeled last paused: they refer to the last observed suspension, not to an execution context that is still active.
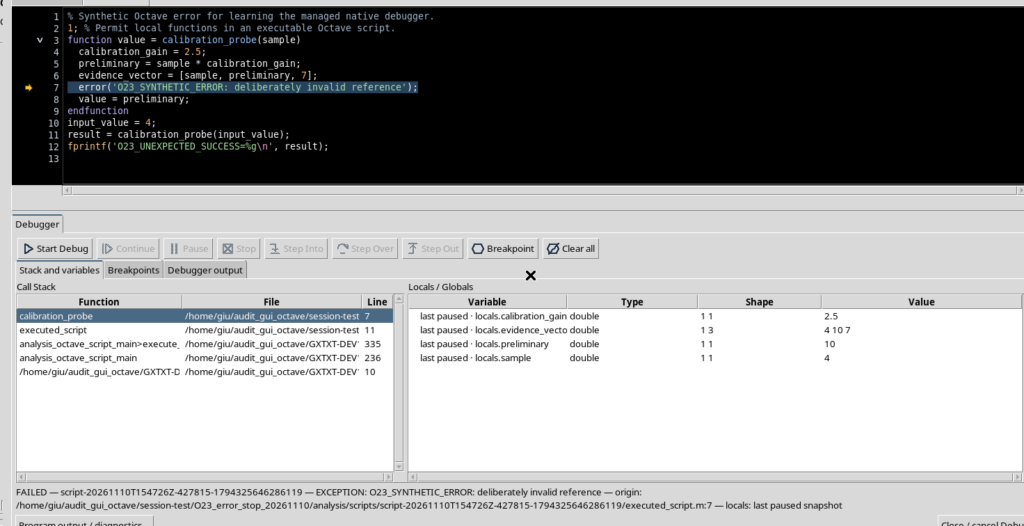
In this version the arrow may remain visible on the originating line after the failure. It must not be interpreted as a Job still in PAUSED: the FAILED state and the disabled stepping commands take precedence over the presence of the symbol.
7. Consulting Debugger Output Without Confusing It with the Program
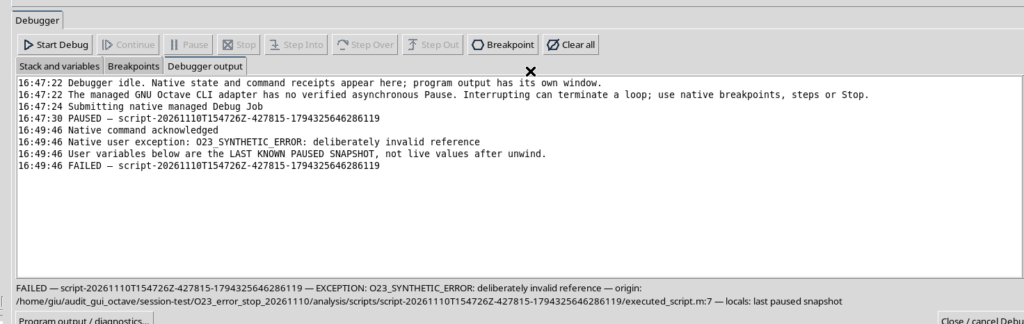
Open the Debugger output tab. It shows the debugger communications, including the native exception message, the state transition and the warning that the exposed variables are the last available snapshot.
The error trace is not a call stack that is still active. Clicking one of its frames after FAILED does not resume the interpreter and does not let you use the Step commands. Consulting the debugger messages is separate from reading the program output streams.
8. Opening the Details of the Failed Job
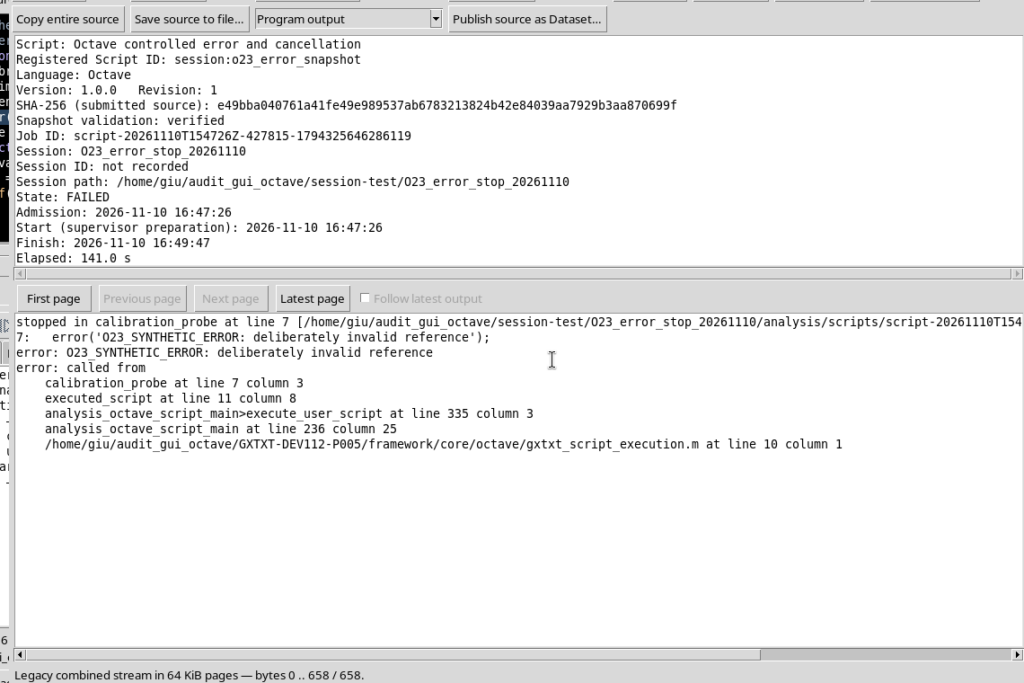
Use Program output / diagnostics… to examine the managed Job. The details show its terminal state FAILED and the message produced by the GNU Octave execution; this information lets you distinguish a script error from a simple suspension.
A finished Job remains available as the result of the execution. A FAILED outcome does not mean that you can press Continue to resume the same Job: to try again after correcting the code you must carry out a new execution, saving the relevant changes first.
9. Interrupting a Second Job with Stop
To see the difference between an error and a cancellation, start a new Debug on a saved Session script and wait for a real PAUSED suspension. In the following example the new Job stops on the first executable statement, line 2, because no active breakpoint is present. If you want to stop at a precise point, check the markers first and use F9.
During PAUSED, the Stop button is enabled. Pressing it means requesting the cancellation of the current managed Job, not executing an Octave line and not simply hiding the debugger window.
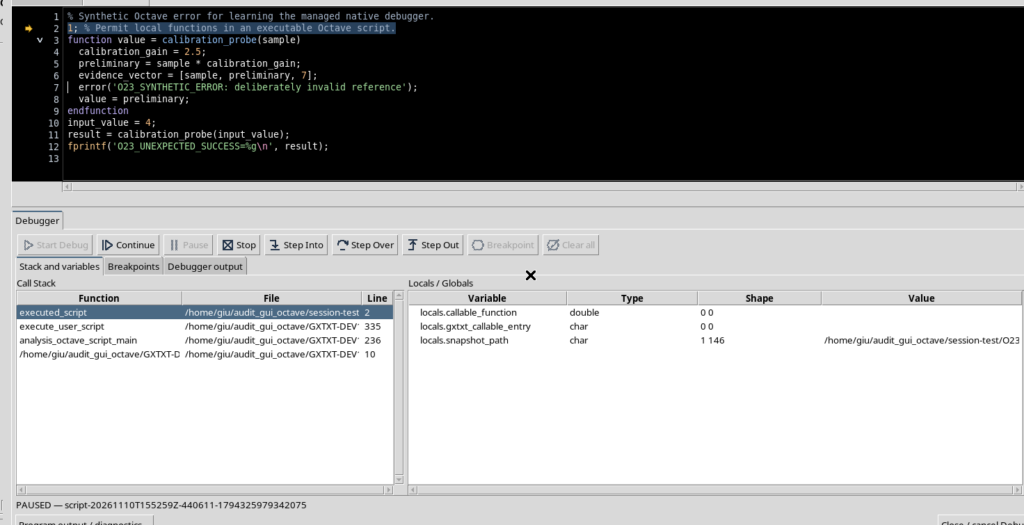
Cancellation is handled asynchronously: watch the state until the terminal transition. In the case shown the Job goes to CANCELLED, while the Call Stack, the active variables and the execution arrow are cleared.
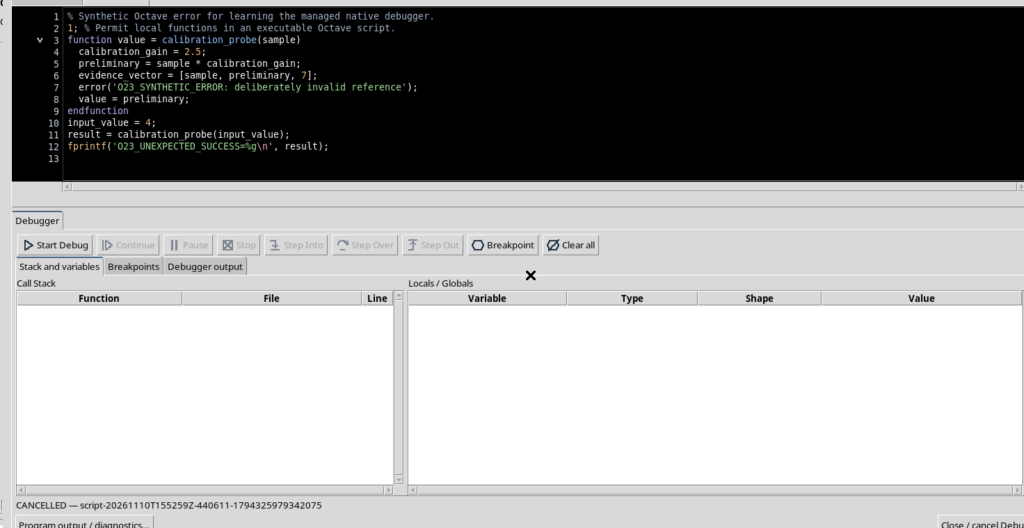
10. Distinguishing the Outcomes and Returning to the Editor
Open Program output / diagnostics… for the cancelled Job too. The details window remains available and identifies the execution as CANCELLED. Comparing the outcomes gives three different meanings: PAUSED is a reversible suspension, FAILED is an error during the program and CANCELLED is the consequence of a stop request.
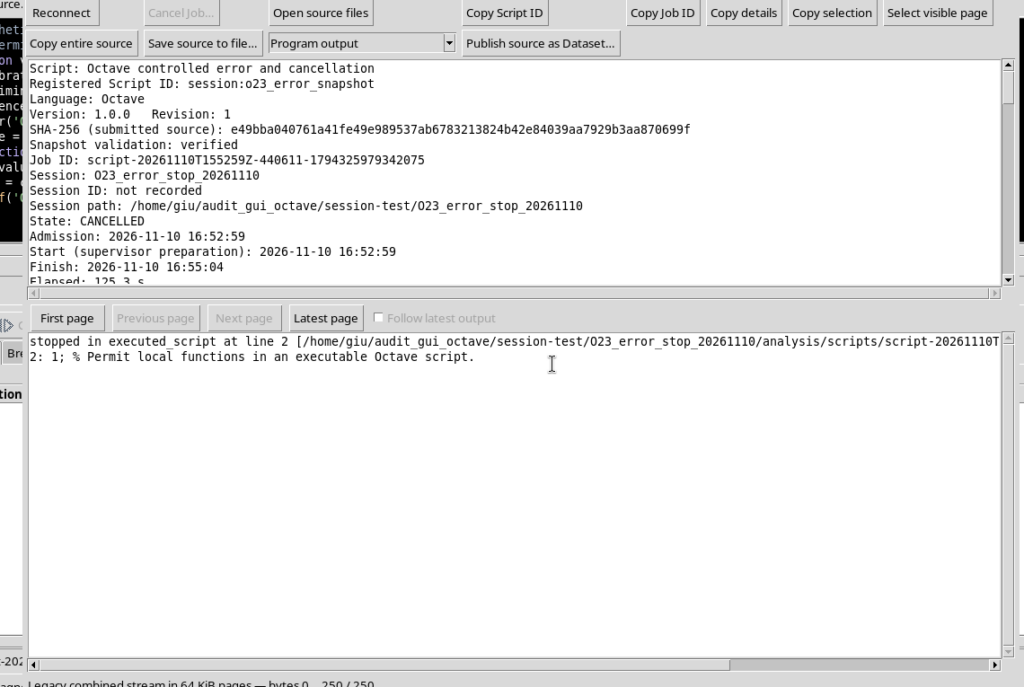
After the terminal state, close the details window and use Close / cancel Debug. To work with the code again, leave the optional panes hidden and use View → Focus source / restore panes when needed. The registered source stays saved; the Job outcomes belong to the execution history, not to the published Datasets.
In short: before acting, always read the actual state of the Job. Use breakpoints and Step commands for a controlled analysis, Stop for cancellation, and the output panes to distinguish debugger messages, Octave errors and execution diagnostics. Do not edit the source assuming that the Job already started will automatically pick up the changes.