

GX-TXT Octave Script Workspace: starting the debugger and step commands
The native debugger of Octave Script Workspace lets you stop a program on a breakpoint, follow the calls between functions and execute one statement at a time. This guide shows the complete sequence with a short numerical computation; the code remains editable in the editor, while Debug runs a saved and immutable revision.
The screenshots show the actual interface of GX-TXT DEV112-P005, Octave Script Workspace 1.8.3, with the editor in High Contrast Dark. The command names match those displayed by the English GUI.
1. Preparing and Saving the Script to Examine
Open Octave Script Workspace while a Session is active. Create a new source from the File → New Script menu, give it a name and an identifier, then enter the following program and choose File → Save. To simplify the work, select View → Focus source / restore panes and leave the panes you do not need closed.
% Synthetic GNU Octave debugger example: no external files or devices.
% Expected result: sum(1:5) = 15.
1; % Permit local functions in an executable script.
function y = adjust(x)
  y = x + 1;
endfunction
function result = accumulate(n)
  result = 0;
  for k = 0:(n - 1)
    increment = adjust(k);
    result = result + increment;
  endfor
endfunction
sum_value = accumulate(5);
fprintf('O21_SYNTHETIC_SUM=%d\n', sum_value);
assert(sum_value == 15);
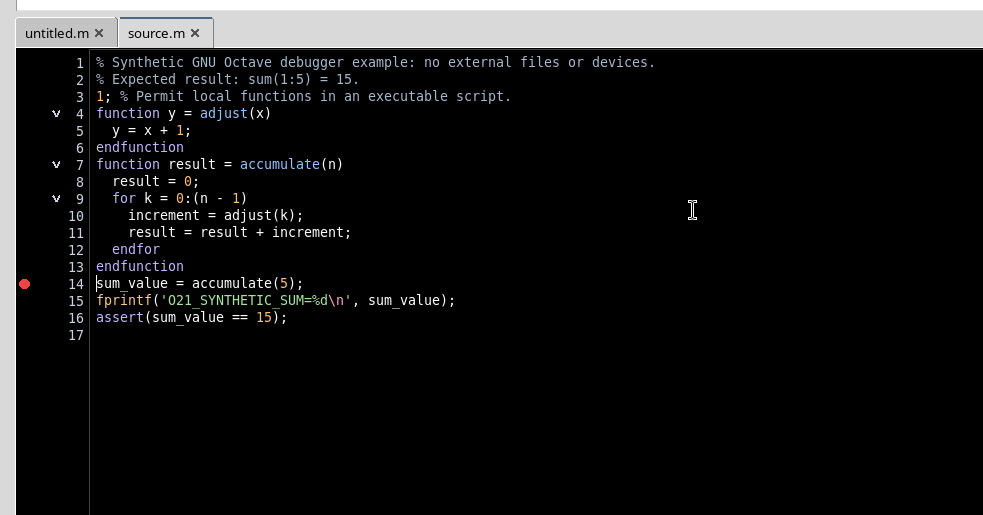
The first numeric statement 1; keeps the file an executable script and allows the two local functions to be defined in it. adjust(x) returns x + 1; accumulate(n) adds up the values obtained by calling adjust for the integers from 0 to n − 1. With n = 5, the expected sum is 1 + 2 + 3 + 4 + 5 = 15. fprintf writes the result to the program output, while assert checks that the final value is correct.
2. Setting the Breakpoint and Opening the Debugger
Move the cursor to line 14, which contains sum_value = accumulate(5);, and press F9. The red circle in the code margin (gutter) indicates the enabled breakpoint. A breakpoint does not execute anything: it only prepares the future suspension of the program.
Select Run → Debug Session script…. Start Debug is available in the Debugger pane. Before starting, the phase is IDLE and the Breakpoints tab lets you check the line and the registered source. The Debug request must refer to a saved Session script with no pending changes; an anonymous, unregistered buffer is not enough.
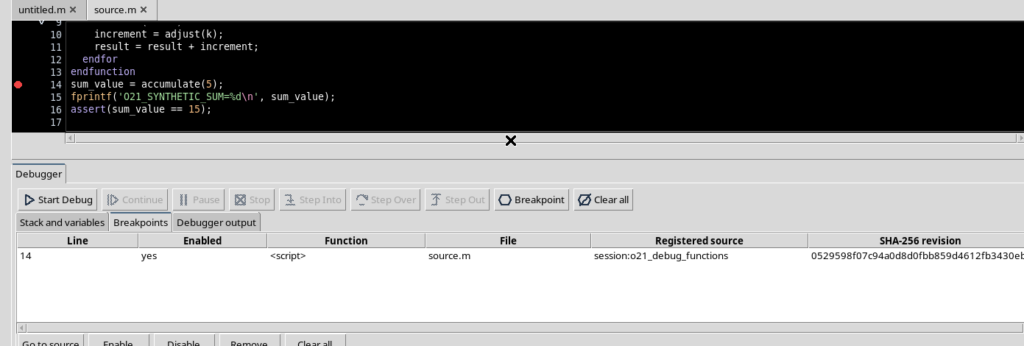
The registration keeps a version of the source identified also by a SHA-256 fingerprint. The Job uses that version, not a copy that can be altered during execution.
3. Pressing Start Debug and Recognizing the PAUSED State
Press Start Debug only once. GX-TXT creates a managed Job and GNU Octave runs the script up to the breakpoint. When the suspension is effective, the pane shows PAUSED; a yellow arrow appears on line 14, indicating the position of the interpreter. The red circle continues to identify the breakpoint separately.
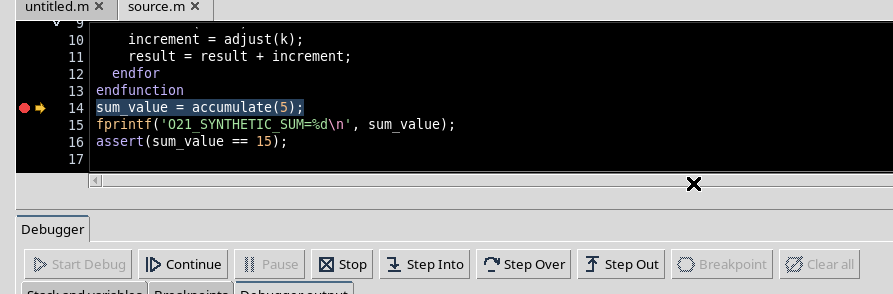
The arrow follows the selected execution frame and does not represent the position of the plain text cursor. The commands for moving forward are enabled only when the Job is actually suspended. Do not confuse STARTING or RUNNING with PAUSED.
4. Using Step Into to Enter the Called Function
While the arrow is on line 14, press Step Into. Octave enters the accumulate function and stops on the first executable statement, at line 8: result = 0;. The debugger shows a new frame of the function, while the frame of the call remains in the call stack.
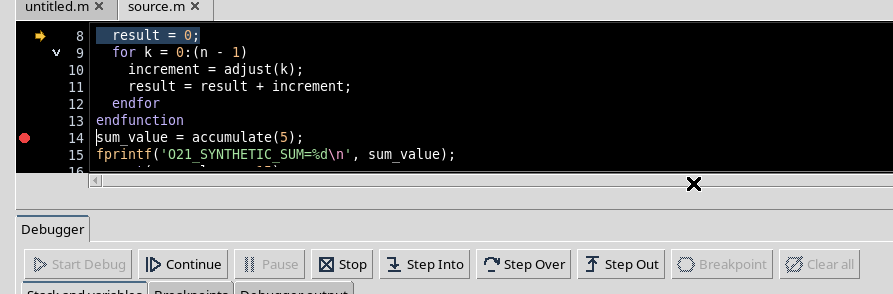
Step Into is useful when you want to understand how a function computes its result, not just which value it returns. Open the Stack and variables tab when you need to consult frames or variables; during normal editing steps it can stay closed.
5. Using Step Over to Move Through the Current Statements
From line 8 press Step Over: the arrow reaches line 9, the header of the for loop.
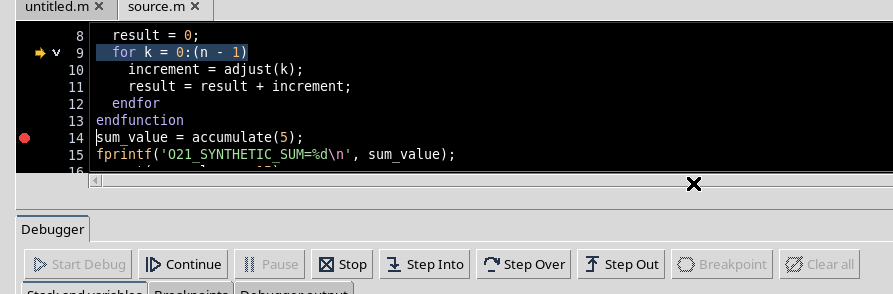
Press Step Over again: in the first iteration of the loop the current position becomes line 10, where adjust(k) is called.
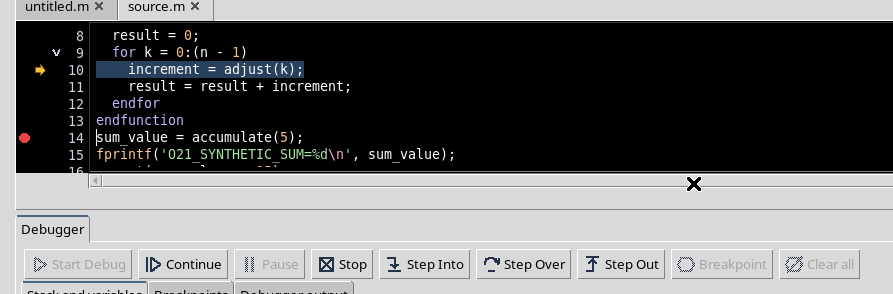
Step Over executes the current statement without stepping through any functions it calls. When you need to examine their content, use Step Into at the call point instead. The position actually reached depends on the statement, on the loop structure and on the program state: it is not always the physical line immediately after.
6. Entering the Nested Function with a Second Step Into
With the arrow on line 10, press Step Into. The debugger enters the adjust function, at line 5: y = x + 1;.
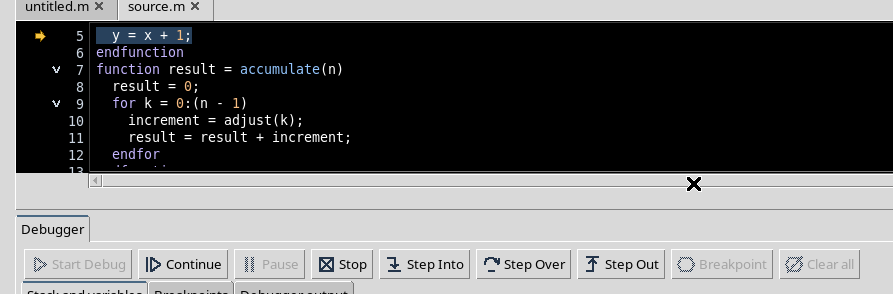
In the first iteration k = 0, so the value received by adjust is x = 0 and its result will be 1. The Stack and variables tab can show, for the selected frame, the type, shape and a representation of the value of the variables. It is not a console for modifying or arbitrarily evaluating expressions: it is an observation summary.
7. Returning to the Caller with Step Out
From the adjust function, press Step Out. Octave completes the current function and returns to accumulate, pausing on line 11: result = result + increment;.
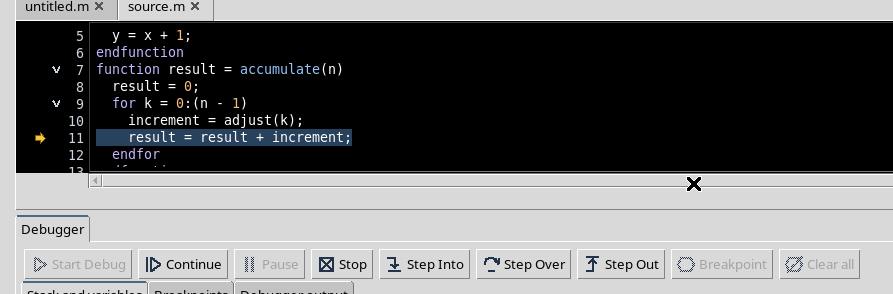
Step Out is therefore the appropriate command when you have entered a function to observe its behavior and want to regain control at the caller level. It is not the same as ending the whole program.
8. Resuming the Job with Continue
When the sequence of interest has been checked, press Continue. Execution proceeds up to another breakpoint, if any, an error or the end of the program. In our example it reaches the end without further interruptions: the pane shows COMPLETED and the yellow arrow disappears from the source.
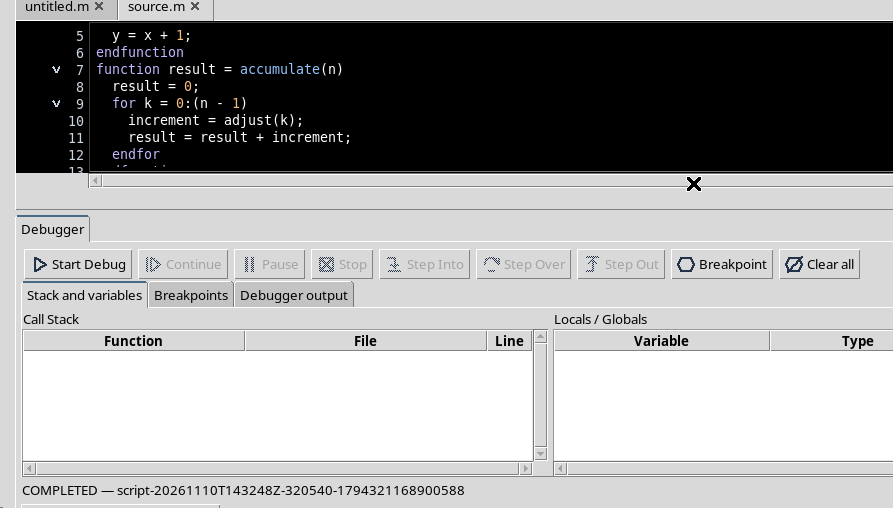
The red breakpoint is a setting of the source, distinct from the state of the Job. A completed Job does not remain paused and cannot be advanced again with Step Into, Step Over or Step Out.
9. Consulting the Output and Checking the Result
From the Debugger pane select Program output / diagnostics…. The details of the executed Job open, from which you can consult Program output, the messages and the execution information. In the case presented the scientifically significant output is:
O21_SYNTHETIC_SUM=15The value agrees with the expected sum. The assert(sum_value == 15) check passed and the Job ended correctly.
Program output is a text stream: it does not automatically correspond to a published canonical Dataset. To use the results as persistent scientific data a separate publication procedure is required, not just a Debug session.
10. Controls, Limits and Returning to the Editor
Continue, Step Into, Step Over and Step Out are the names of the Debugger buttons. In this interface the F5, F10 or F11 shortcuts are not automatically assigned to these commands: use the buttons shown or their normal keyboard activation.
The asynchronous Pause function of the GNU Octave backend is disabled: to suspend execution prepare a breakpoint, then use the stepping commands from the PAUSED condition. Stop requests the cancellation of the active Job; it must not be confused with Step Out. Handling error cases and interruption during a computation is covered separately.
At the end, close the Job details window and choose Close / cancel Debug when the Job has already finished. If necessary, re-enable View → Focus source / restore panes to return to a wide and readable work area.
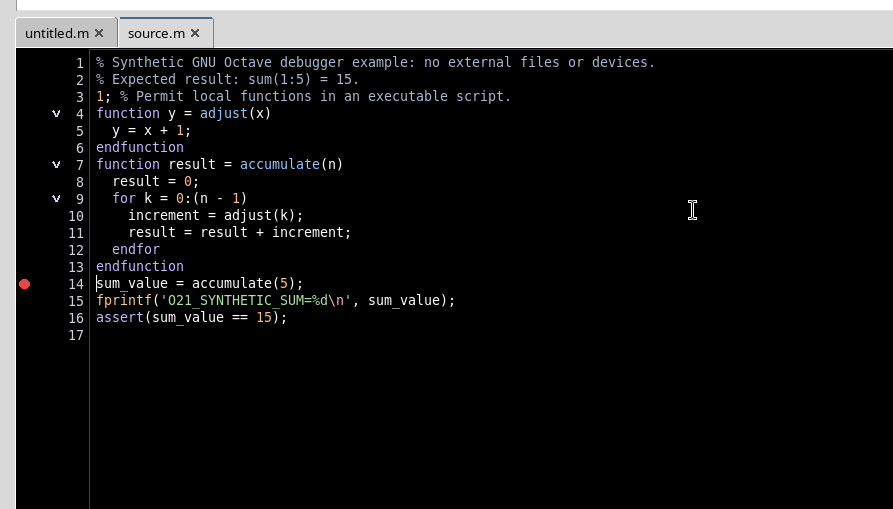
The operating rule is to keep three levels separate: saved source, immutable execution Job and current debugger state. This distinction makes the result reproducible and prevents an edit in the editor from being interpreted as if it were already part of the computation that was started.