

Call Stack, Locals and execution frames
During the Debug of an Octave script, the Call Stack lets you go back from the suspended function to the calling functions. The Locals / Globals pane shows, for the selected frame, the type, dimensions and a summary of the values of the variables. This guide shows how to consult this information without altering the running program.
The screenshots come from the interface of GX-TXT DEV112-P005, module Octave Script Workspace 1.8.3. The editor uses High Contrast Dark; the surrounding Tk/ttk controls keep their native rendering. The English command names are those actually present in the application.
1. Preparing the Script with Two Functions and a Global Variable
Open Octave Script Workspace in an active Session, choose File → New Script, fill in the identifier and save the source with File → Save. Use the following fully numerical example, with no input files or links to devices.
% Local debugger illustration: only synthetic numerical data.
1; % Enable local functions in an executable GNU Octave script.
global calibration_gain;
calibration_gain = 2.5;
function result = compute_report(samples)
  global calibration_gain;
  weights = [1, 2, 3];
  matrix = [1, 2; 3, 4];
  descriptor = 'lab sample';
  long_vector = 1:40;
  result = inner_total(samples, weights, matrix);
endfunction
function total = inner_total(samples, weights, matrix)
  global calibration_gain;
  offset = samples(1) * calibration_gain;
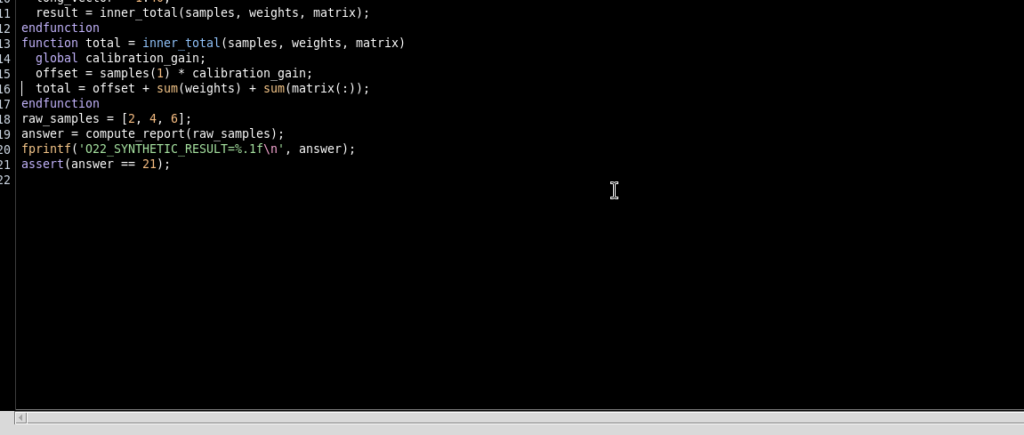
  total = offset + sum(weights) + sum(matrix(:));
endfunction
raw_samples = [2, 4, 6];
answer = compute_report(raw_samples);
fprintf('O22_SYNTHETIC_RESULT=%.1f\n', answer);
assert(answer == 21);
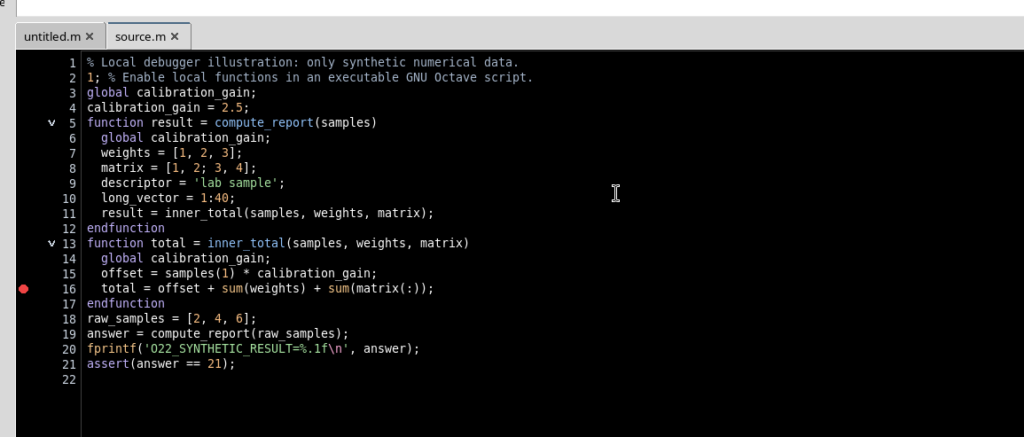
The initial statement 1; allows local functions to be included in a file executed as a script. compute_report prepares the data; inner_total performs the computation. With the first sample equal to 2 and the gain equal to 2.5 you get offset = 5. The weights add up to 6, the matrix elements add up to 10 and the expected result is 21.
Move the cursor to line 16, containing the assignment to total, and press F9. The red dot in the margin indicates an enabled breakpoint; it is not an execution command.
2. Opening the Debugger and Showing the Two Useful Panes
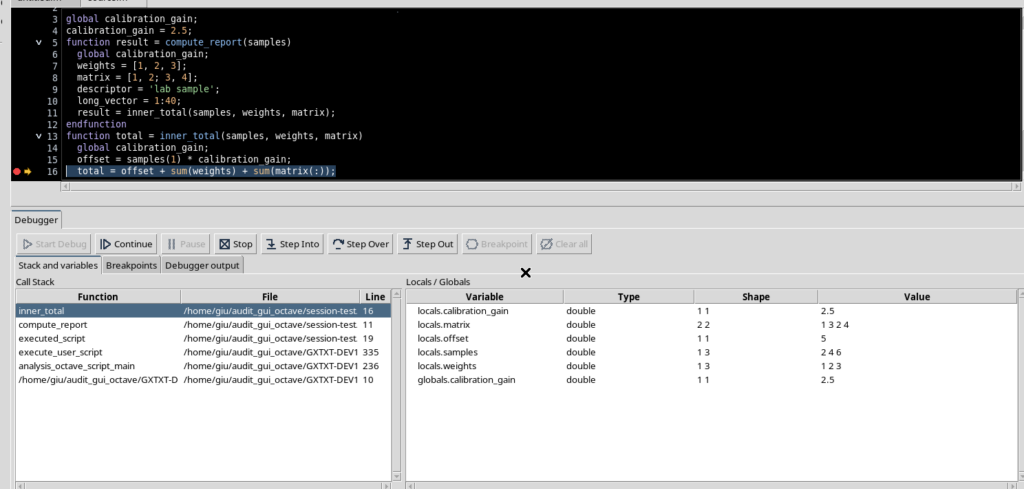
Select Run → Debug Session script… and press Start Debug. The Job uses a saved revision of the source and stops on line 16. The PAUSED state and the yellow arrow are the signs of a real suspension.
Open View → Call Stack and View → Variables / Locals. In the debugger choose the Stack and variables tab. To keep room for the source, hide Script properties, Parameters, Version, Explorer and Snippets when they are not needed. The two debugger views are shown side by side.
3. Interpreting the Order of the Call Stack
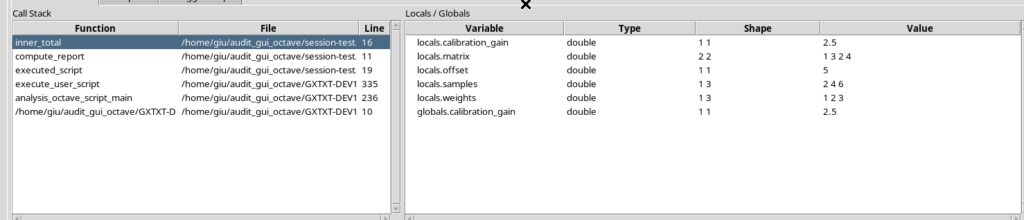
The Call Stack shows the current frame at the top and the previous calls below it. In the example the path starts from inner_total (line 16), goes back to compute_report (line 11), then to the script that invoked the function (line 19). Further down there are also frames belonging to the execution runtime.
The Function, File and Line columns distinguish the function name from the code position. The selected row must not be confused with a breakpoint: the breakpoint stays on line 16 even when you examine a caller.
4. Selecting the Calling Frame compute_report
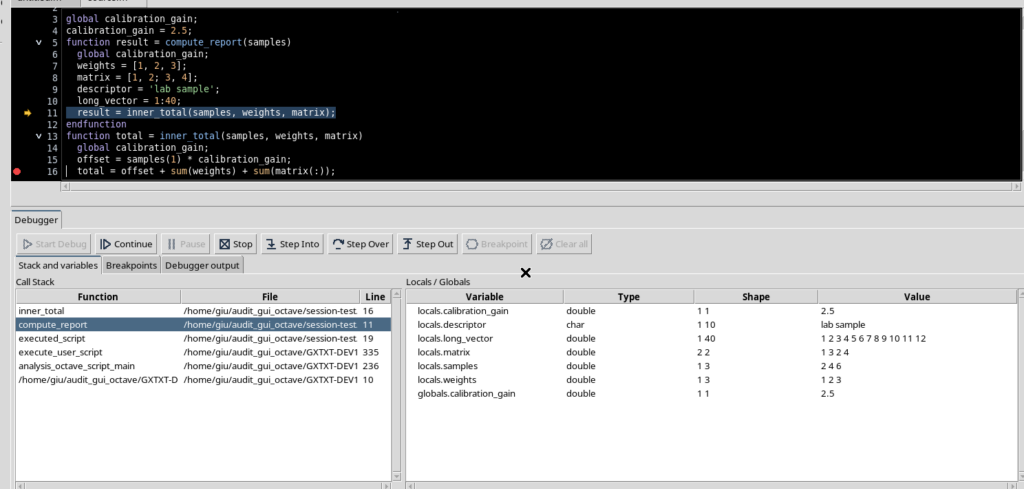
Click the compute_report row in the Call Stack. The selection asks the native debugger to inspect that context; the highlighted line in the source moves to the inner_total(…) call, line 11.
This is not Step Into, Step Over or Continue: the program remains PAUSED and the statement actually suspended stays inside inner_total. Only the frame whose code and variables are shown changes.
5. Reading Type, Shape, Value and the Limited Summary
In the compute_report frame, the pane contains variables of different kinds. The descriptor variable is a char string, shape 1 × 10, with value lab sample. weights is a 1 × 3 double vector; matrix is a 2 × 2 double matrix. calibration_gain appears among the local variables visible in the frame and also in the globals section, with value 2.5.
The long_vector variable has shape 1 × 40, but the Value column shows only the first 12 elements, from 1 to 12. This is an abbreviated representation, not a reduction of the vector in memory. The Type and Shape information continues to describe the complete variable.
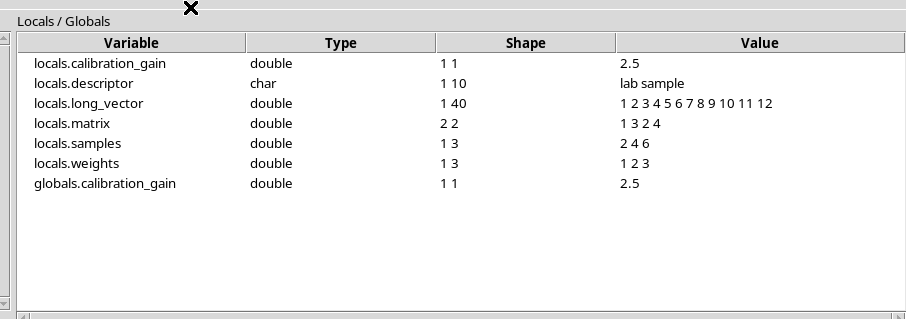
For the matrix [1, 2; 3, 4], the numerical summary may appear as 1 3 2 4: Octave traverses the elements in column-major order. To recognize the structure, read Shape and Value together, rather than rebuilding the rows from the displayed sequence alone.
6. Going Back to the Main Script
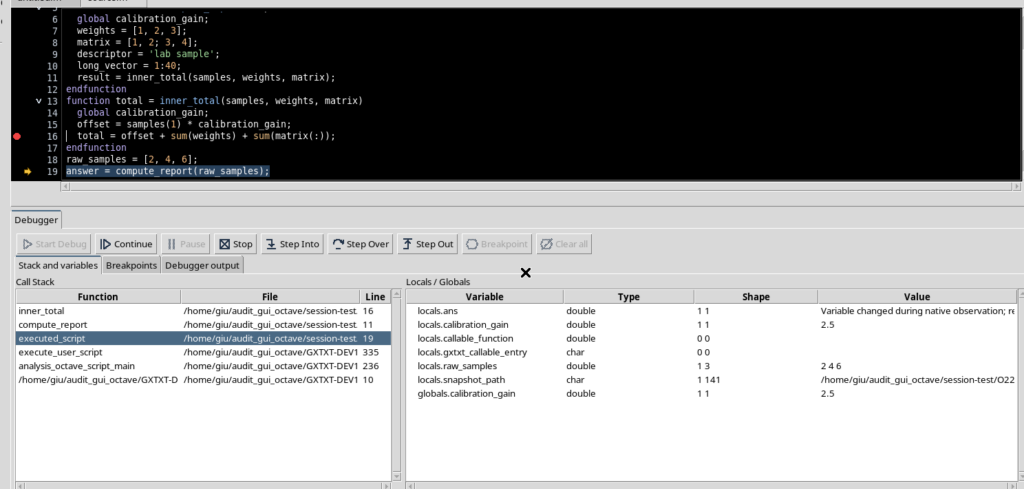
In the Call Stack select the frame of the main script, named executed_script in the managed Job. The position points to line 19, that is, the call answer = compute_report(raw_samples);. Here you can consult, among others, the variable raw_samples = [2, 4, 6].
Selecting a higher frame does not run the function again and does not change the content of answer. The values shown are those observed in the context stopped at that moment; the GUI does not work as a console that evaluates arbitrary expressions.
7. Distinguishing a Frame Outside the Registered Source
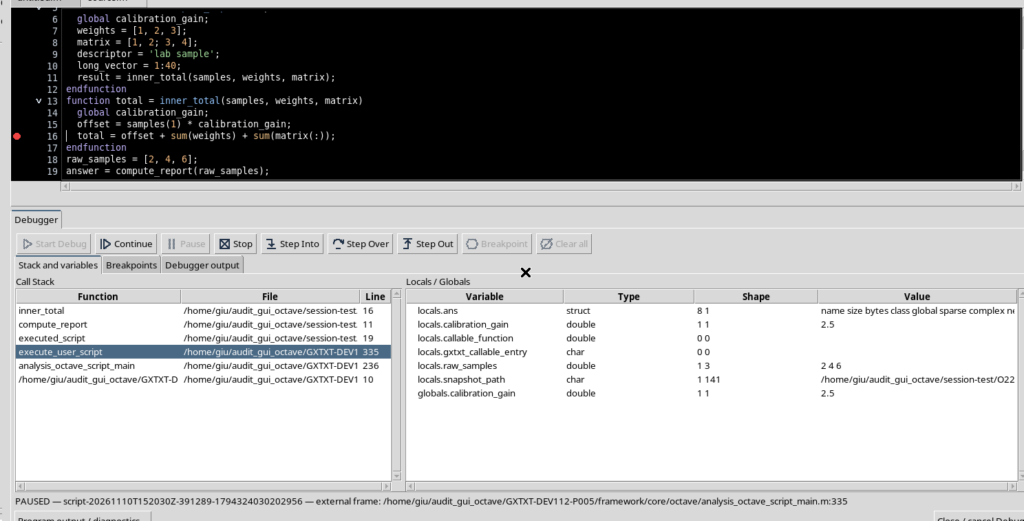
The same list contains an execute_user_script frame, belonging to the GX-TXT Octave executor, not to the code written in the editor. When you select it, the variables pane shows data related to that context and the status line reports external frame.
The position arrow in the user’s source is removed from view while the external frame is selected: it would not be correct to attribute a line of the user’s file to it. You do not need to open, modify or copy the runtime files to use this information.
8. Returning to the Actually Suspended Frame
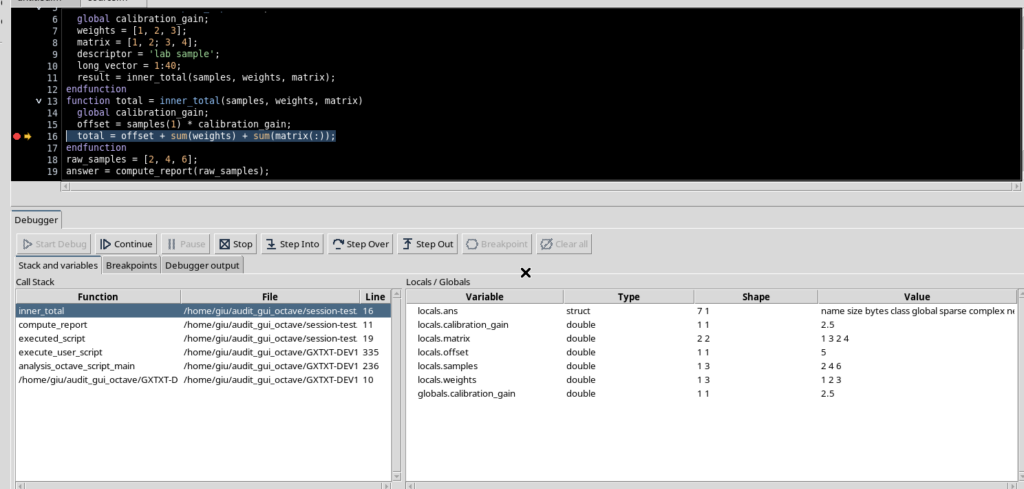
Select inner_total again, the first row of the Call Stack. The highlighted position returns to line 16; the summary again includes offset = 5, samples, weights, matrix and calibration_gain.
This is a useful check when exploring several callers: the execution frame remains the same throughout the inspection, while the selected frame can change.
9. Continuing and Examining the Result
With the Job still PAUSED, press Continue. The interpreter completes the computation, checks the assert and reaches COMPLETED. From Program output / diagnostics… you can consult the output printed by the program:
O22_SYNTHETIC_RESULT=21.0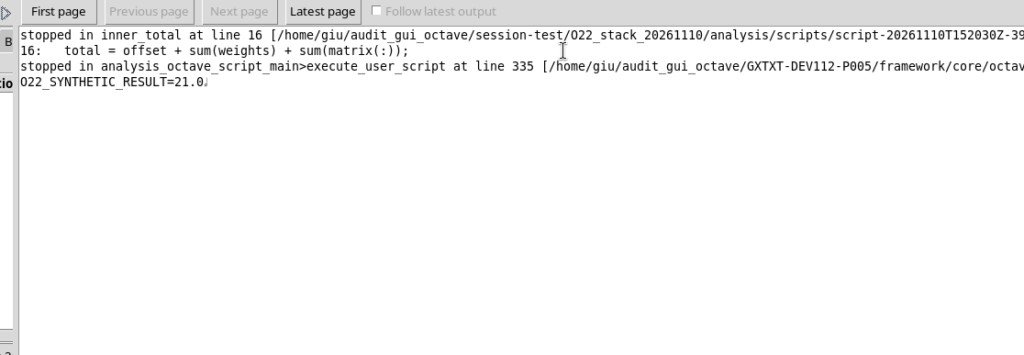
Viewing an external frame, a caller or an abbreviated vector has not changed the result of the program.
10. Returning to the Normal Editor View
Close the details window and use Close / cancel Debug when the Job has already finished. Hide the optional views and, when appropriate, apply View → Focus source / restore panes. The source stays saved, the execution arrow is no longer present and the completed Job remains available in the Job management tools.
Important limit: Locals / Globals exposes read-only summaries that are deliberately limited by type, shape and value. It is not a Watch window, it does not allow arbitrary code to be evaluated and it does not replace the scientific analysis of Datasets. To advance in the program use the debugger controls, not frame selection.