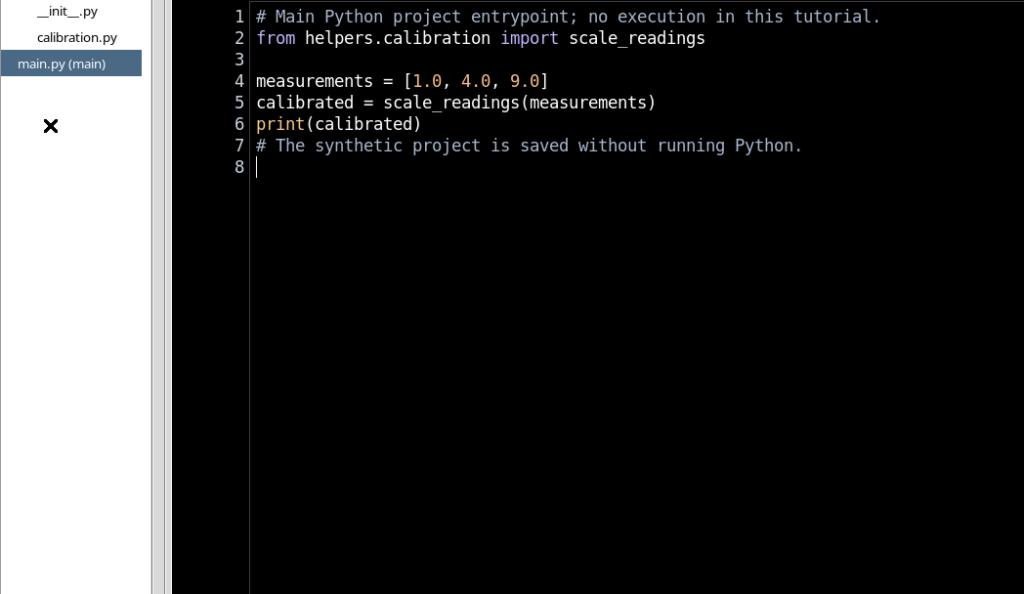
GX-TXT Python Script Workspace: Pause, Continue and stepping in the native debugger
The GX-TXT native Python debugger lets you run a registered Script one line at a time, step into functions, return to the caller and suspend a computation. The main controls are Start Debug, Continue, Pause, Stop, Step Into, Step Over and Step Out. This guide explains the actual behaviour of the buttons, the Job states and the conditions needed to use debugging on the correct revision of the code.
1. Debugger and normal Run Job
Debug mode runs the program through the GX-TXT supervisor, but does so with a Python adapter that observes the source statements. It is different from Validate review, which checks a request without running it, and from a normal Run Job, which runs the program without stopping at debug points. A Debug Job keeps the identity, revision and SHA-256 of the registered Script: it does not arbitrarily run what appears in the editor if it contains unsaved changes.
2. Preparing an example with distinct functions
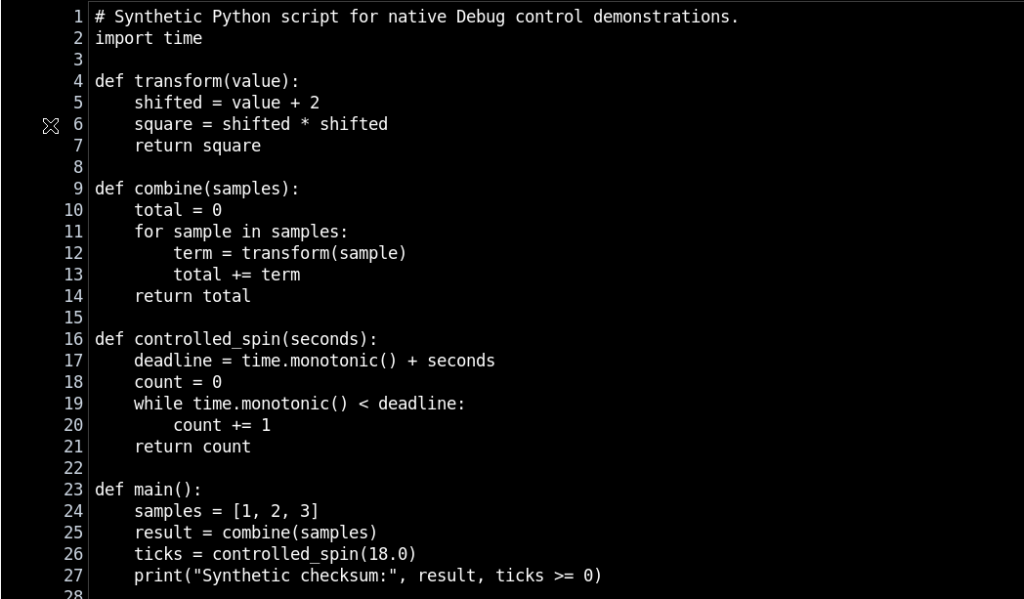
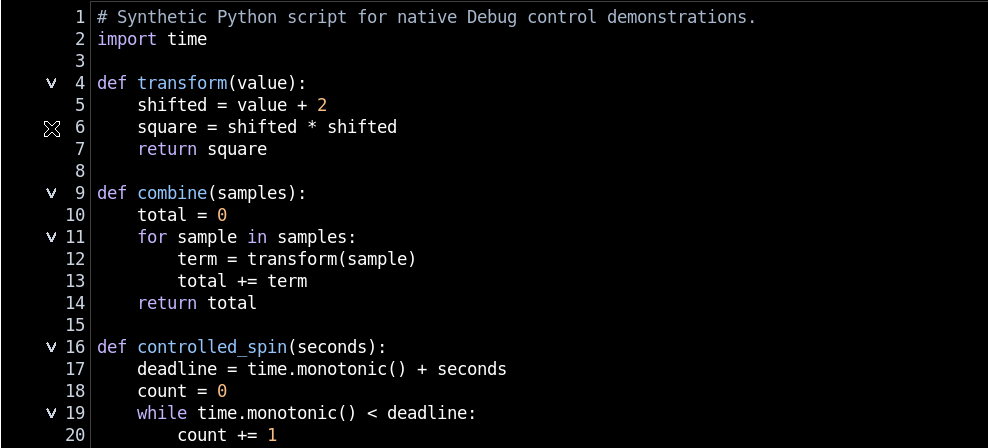
Open a Session, create a new Python Script and enter a small synthetic example. It is preferable to use a program without physical instruments, remote access or publications: line-by-line progress must be easy to observe. Our code includes transform, combine, main and a controlled wait function, controlled_spin.
3. Saving before running Debug
After filling in Script ID, Name, Version and Scope, press File → Save. The Script is registered in the Session, with a revision and a SHA-256 of the source. The debugger works on the immutable copy of that revision. Any text changes require a new save before the next Debug session.
4. Choosing a call line
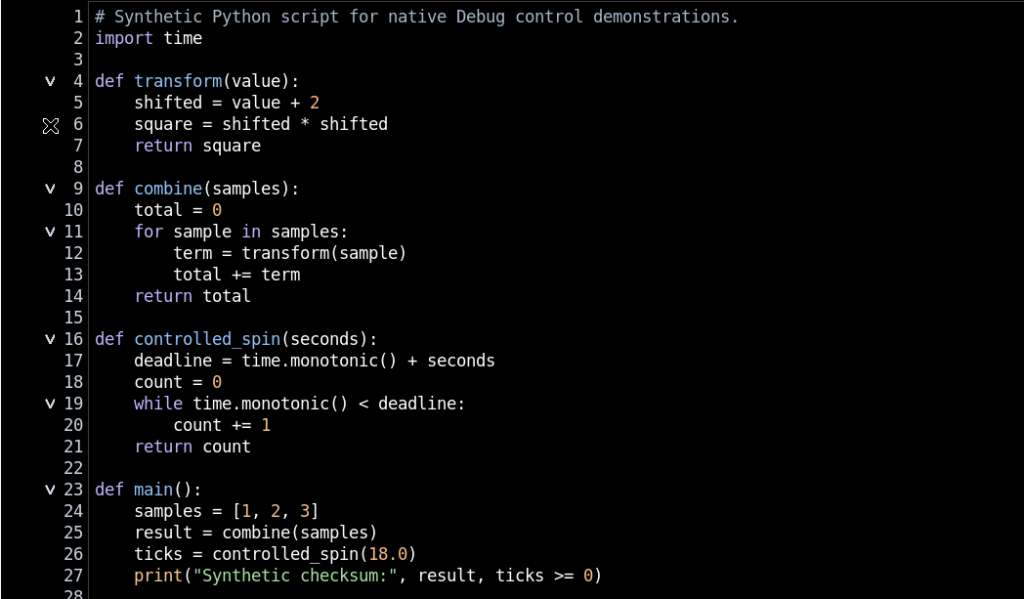
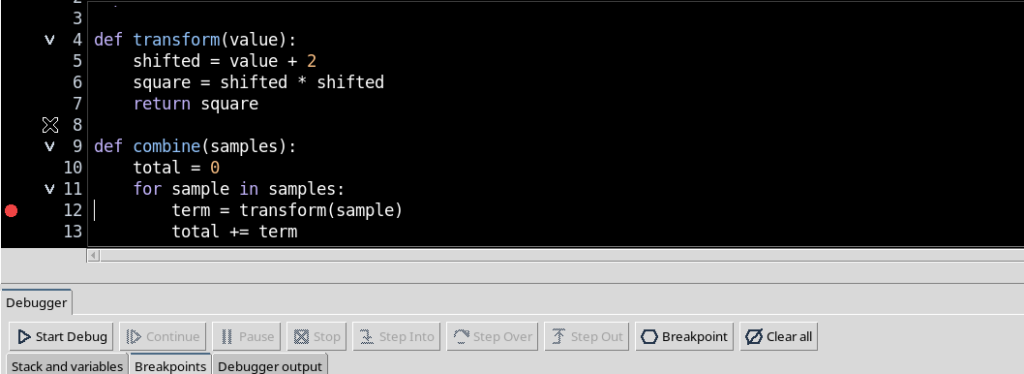
In the example, combine calls transform on line 12. This line is useful to distinguish Step Into, which enters the function, from Step Over, which keeps control in the caller. Move the cursor to the call line and press F9 to create the breakpoint. A red circle appears in the margin; F9 does not start Python.
def transform(value):
    shifted = value + 2
    square = shifted * shifted
    return square

def combine(samples):
    total = 0
    for sample in samples:
        term = transform(sample)
        total += term
    return total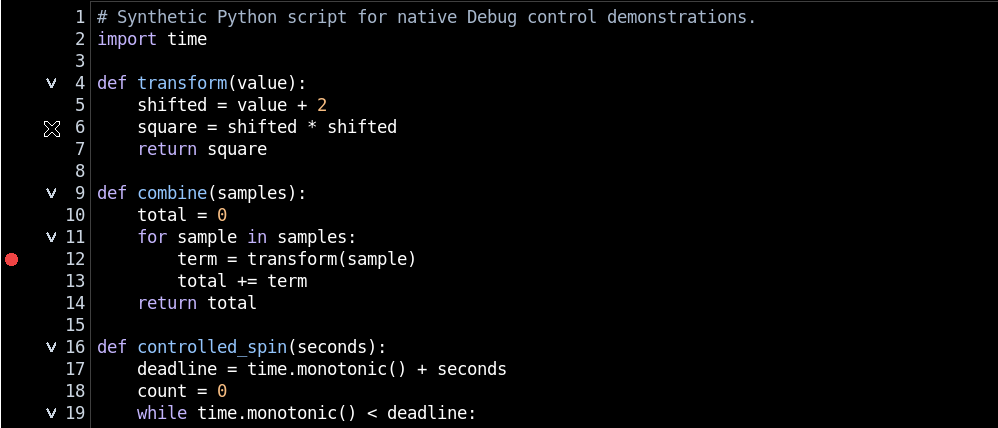
5. Opening the Debugger panel
Use Run → Debug Session script…. The original bar contains Start Debug, Continue, Pause, Stop, Step Into, Step Over, Step Out, Breakpoint and Clear all. When the debugger is still IDLE, only Start Debug and the appropriate breakpoint operations are active; the controls that require a paused Job remain disabled. For this guide the Breakpoints or Debugger output tab is sufficient: Call Stack and Variables will be covered separately.

6. Start Debug and first suspension
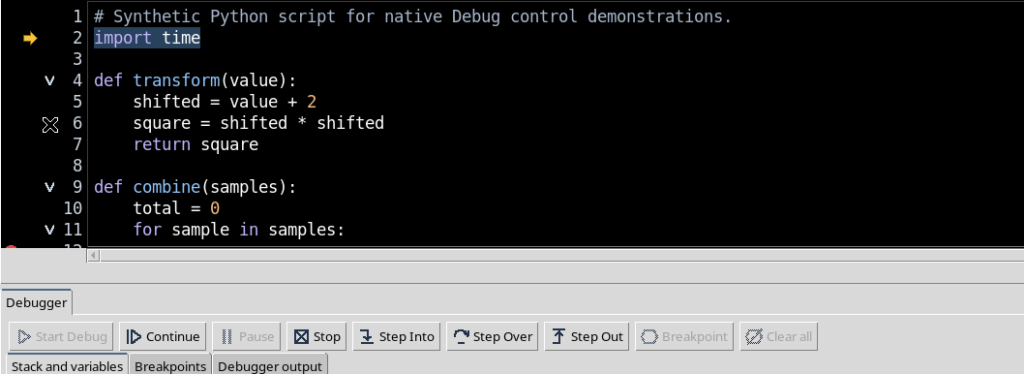
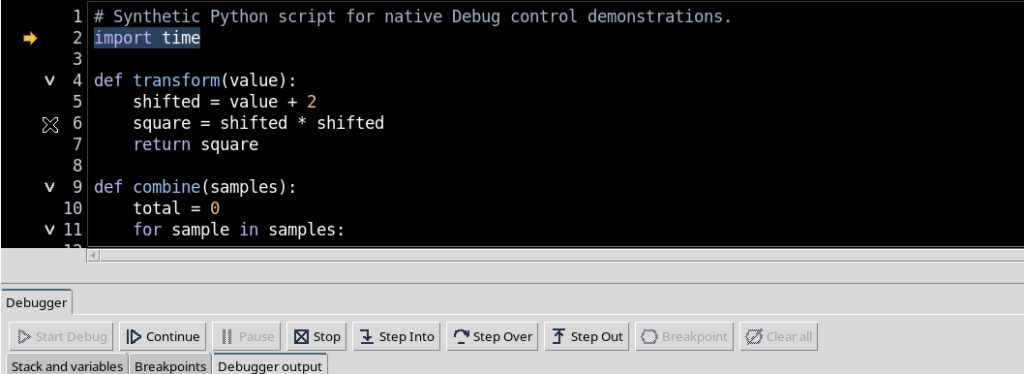
Press Start Debug with the registered, clean source. The native Python adapter creates a Job managed by the supervisor; execution initially stops on the first observable statement of the file, in the example import time on line 2. The debugger shows PAUSED and the margin draws a yellow arrow. This first pause can appear even before a breakpoint inserted by the user is reached.
7. Continue up to the breakpoint
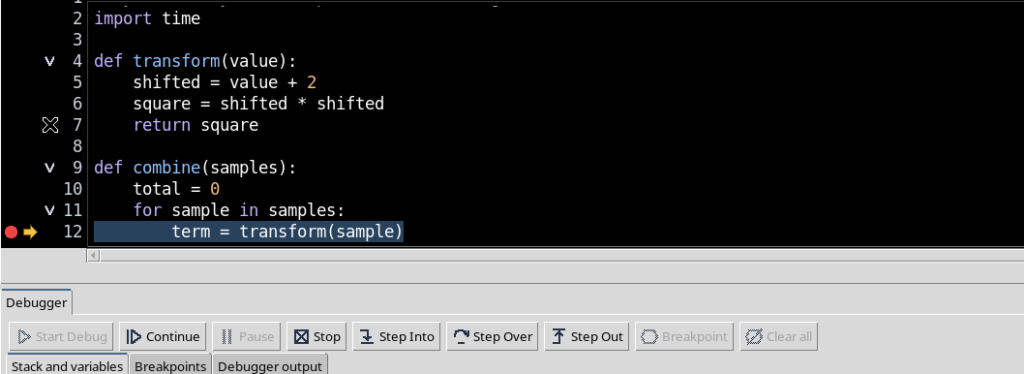
From PAUSED, press Continue. The debugger lets Python advance up to the next valid breakpoint. In the example, execution stops on line 12 of combine, before running transform(sample). The yellow arrow indicates the current position, while the red circle marks the preset breakpoint. Continue is not the same as running a single line.
8. Step Into enters the called function
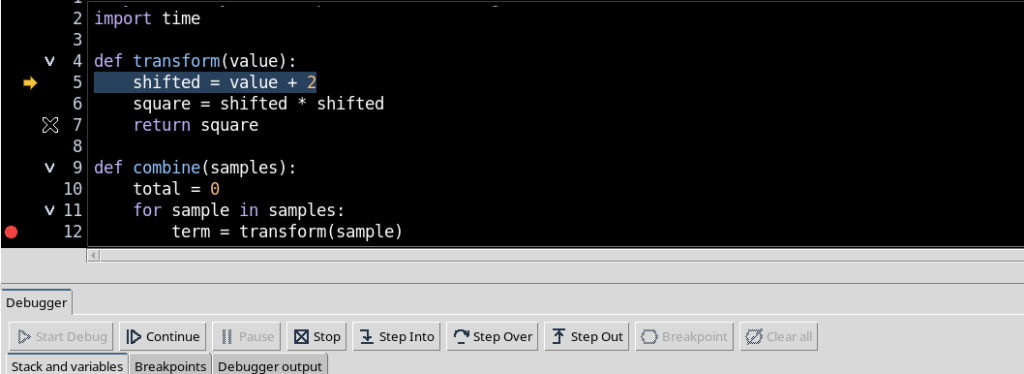
With the Job paused on the call term = transform(sample), press Step Into. Control passes from the function combine to transform and the debugger stops on its first executable statement, line 5. This is the command to use to understand the inner workings of the invoked function. The cursor selection in the code does not replace the Step Into control: what counts is the line actually indicated by PAUSED.
9. Step Over advances within the same function
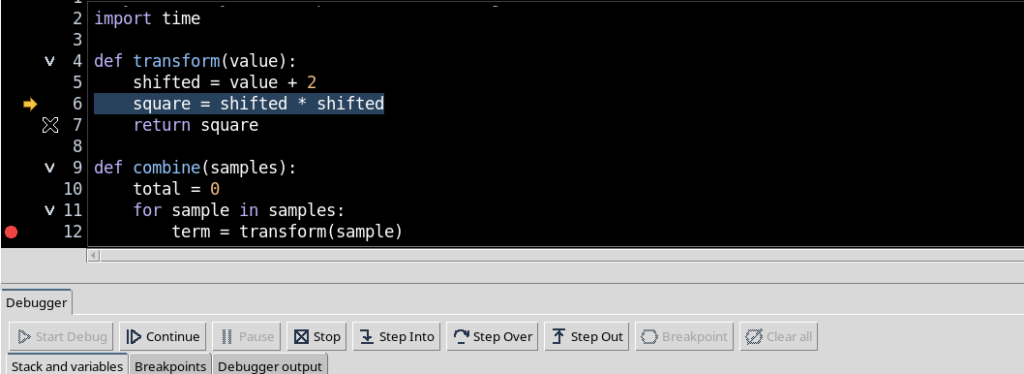
Inside transform, the Step Over command runs the current statement and stops at the next relevant line of the same call level. In the example, the debugger goes from line 5 to 6, where it computes square = shifted * shifted. If the current line contains a call to another function, Step Over normally lets you complete it without entering its individual statements.
10. Step Out returns to the caller
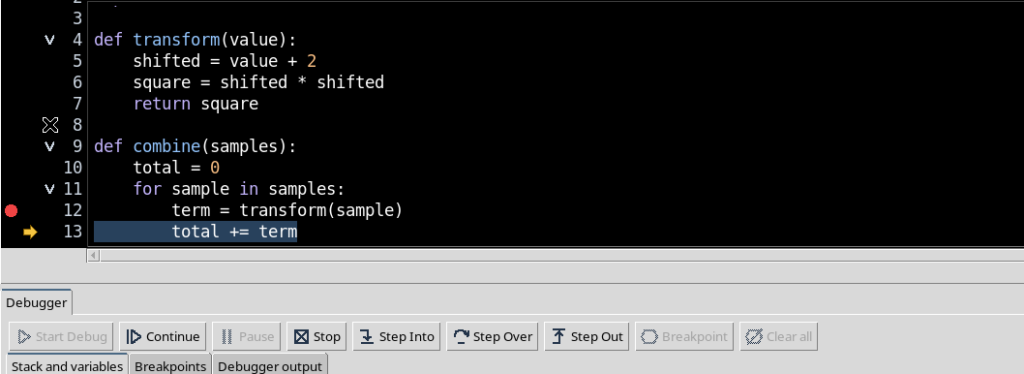
If you do not need to examine the rest of the active function, use Step Out. The debugger lets transform finish and returns to the calling function combine, stopping in the example on line 13, total += term. Step Out is therefore particularly useful when you have entered a function by mistake or have already understood its behaviour and want to resume your reasoning in the caller.
11. Comparing Step Into, Step Over and Step Out
The fundamental difference is the call level. Step Into follows the code of a called function; Step Over lets the current line complete without entering the details of any calls; Step Out completes the current function and resumes in the caller. The three controls require a Job in the PAUSED state and work on the saved source copy. They are not text navigation commands of the editor.
12. When the buttons are active
The debugger states determine which buttons can be used. In IDLE Start Debug is available. In PAUSED Continue, Step Into, Step Over, Step Out and Stop are active, while Pause is not needed because execution is already suspended. In RUNNING, the Pause command may be available to request an asynchronous suspension; the Steps remain disabled until a new stop. The tooltips repeat the actual names of the commands. Do not automatically assume the F5, F10 or F11 shortcuts of other environments: use the buttons shown by GX-TXT.
13. The yellow arrow is different from the breakpoint
The red breakpoint is a rule set by the user on an executable line. The yellow arrow is instead an observation of the position reached by the interpreter. When the Job is paused on the breakpoint, the two symbols can appear side by side. If you proceed with Step Into or Step Out, the arrow changes line and function, while the point stays in its original position. It is the arrow, together with the PAUSED state, that documents where execution actually is.
14. Stop ends a managed Job
If you do not want to continue, press Stop in the Debugger. The button asks the supervisor to interrupt the current Job; there is no need to manually terminate the Python interpreter. In the example the stepping Job ended with final state CANCELLED and the debugger removed the yellow arrow. CANCELLED is not the same as a normally COMPLETED computation.
15. A Debug Job does not automatically publish Datasets
The fact that the debugger has run Python statements does not necessarily mean that a canonical Dataset has been published. Logs, states and frozen copies of the Script are part of the traceability of the Job, but numeric results become Datasets only through an authorised publication operation. This example uses synthetic data and performs no publication.
16. Preparing the Pause test without breakpoints
To distinguish an asynchronous suspension from a programmed stop, close the previous Job and remove all breakpoints with F9 or Clear all. This way no red line remains that could cause an automatic pause. The test program contains a function controlled_spin with a loop of limited duration that runs repeated statements, without external instruments or Datasets.
17. Start Debug is initially PAUSED even without points
When a new Debug Job is opened without breakpoints, the debugger still stops on the first observable statement, in the example line 2. From here you can use Continue to bring the Job into the RUNNING state. It is important to distinguish this initial suspension from a later Pause request made during the actual work of the program.
18. Pause is available when Python is RUNNING
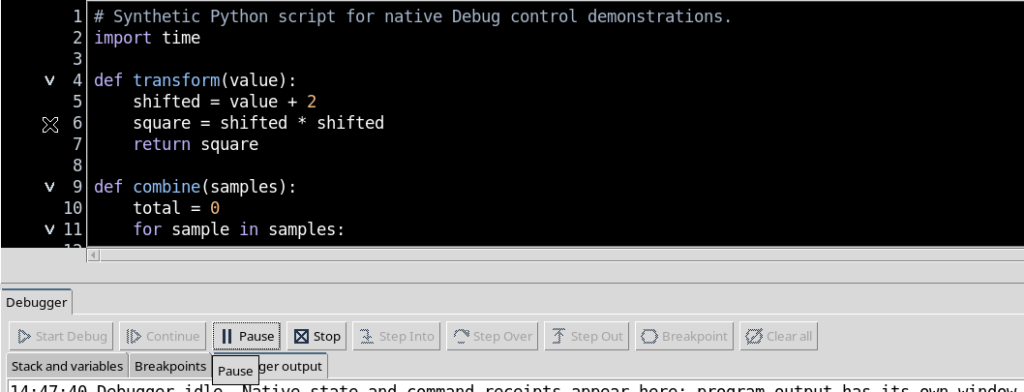
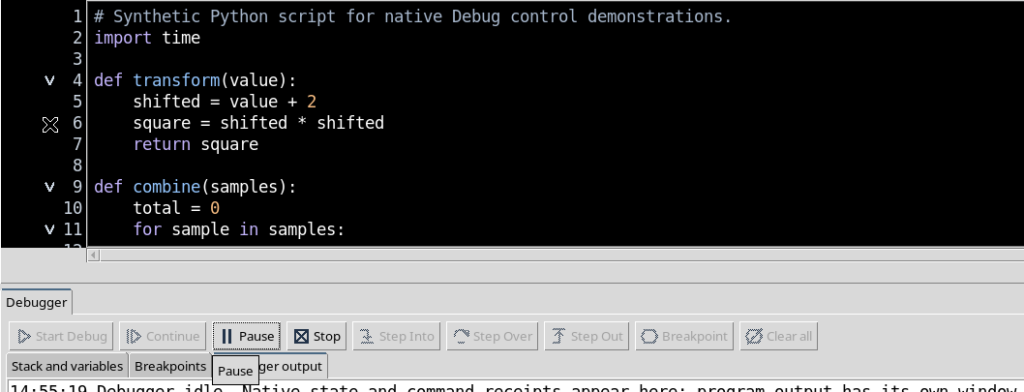
With the Python adapter installed, the panel declares support for asynchronous Pause. During RUNNING the Pause button becomes active and the original tooltip shows Pause. The command requests suspension of the managed Job; its click does not, by itself, prove that the interpreter has already stopped. You need to observe a subsequent PAUSED state and the yellow arrow on the source.
19. A limitation of suspension without breakpoints
In the version described here a limitation emerged: if there is no breakpoint at all, a program that enters nested Python functions can continue to COMPLETED even after Pause has been accepted. The button is still presented as available, but suspension is not guaranteed in this situation. Therefore do not consider a click on Pause a confirmation of a stop; if you need to interrupt the Job, use Stop and check the final state.
20. Why function tracing matters
The adapter uses the standard Python debugger bdb, which may avoid tracing calls in some functions when no breakpoints are present. In that situation the asynchronous control might not be detected during the inner loop. This limit concerns the combination of tracing and suspension, not the scientific computation of the program. The behaviour can be checked with synthetic code, without modifying the GX-TXT sources.
21. Checking Pause with a future breakpoint
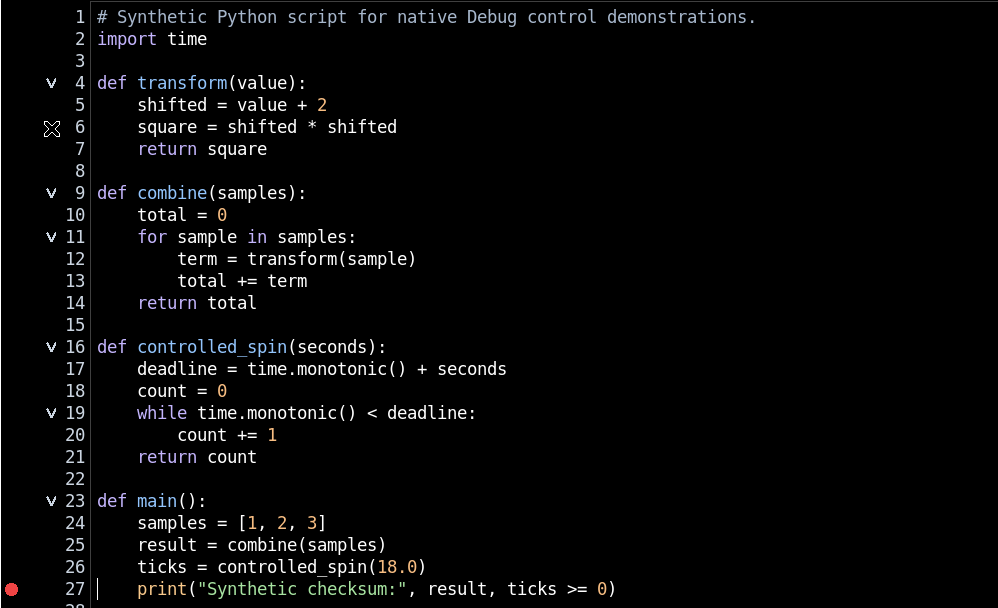
To distinguish the actual support for Pause from the previous limitation, in the test a breakpoint was placed on a line after the loop, line 27. That point is not reached before the suspension. Its presence keeps function tracing active for the same file, making it possible to check whether Pause behaves as an asynchronous stop. It is a diagnostic condition of the example, not a general suggestion to insert arbitrary points in scientific programs.
22. The Pause command before the future point
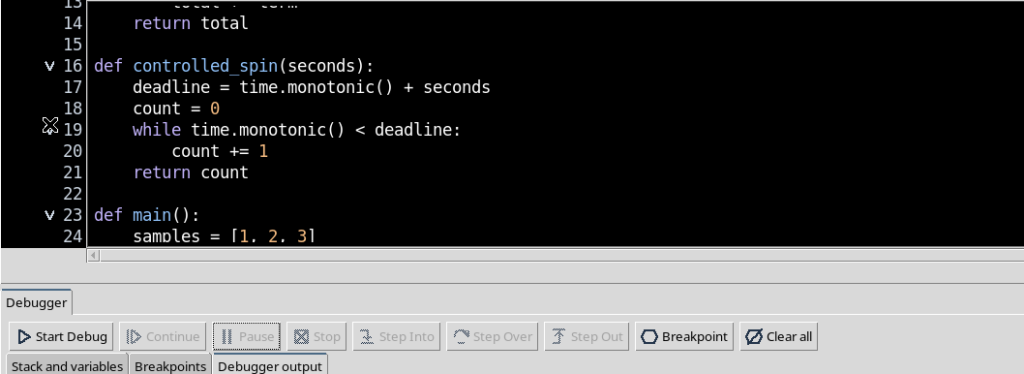
Once the new Job is started, the sequence remains Start Debug → initial PAUSED → Continue → RUNNING. With the program already in the loop, Pause is still enabled. The user requests suspension while the future breakpoint has not been reached. The presence of the point in the figure must not be interpreted as the immediate cause of the pause: the decisive check is the line actually observed when PAUSED appears.
23. A real asynchronous suspension in the loop
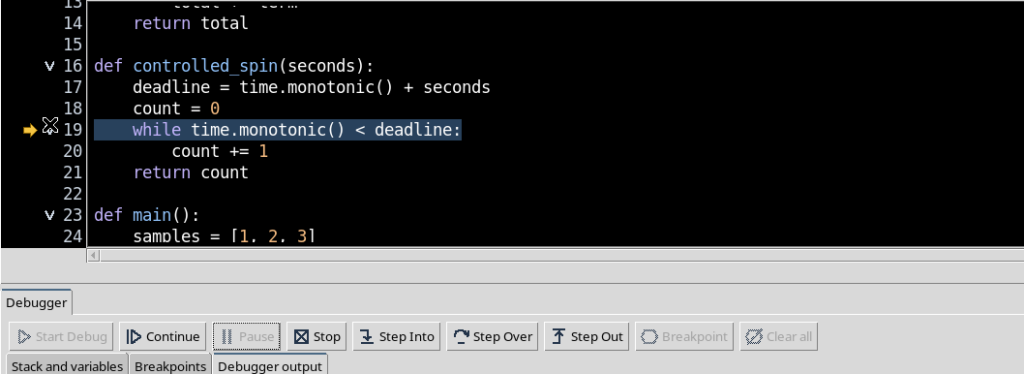
In the controlled test, the Pause command actually interrupted the function controlled_spin on line 19, that is, on the condition of the while loop. The Job was RUNNING and went to PAUSED, showing the yellow arrow on line 19. The breakpoint prepared on line 27 had not been reached. This demonstrates the actual operation of Pause when function tracing is active.
24. What you can do after Pause
When the state is really PAUSED, Continue, Step Into, Step Over, Step Out and Stop become available again. The observed execution always belongs to the same Job and to the same immutable revision of the Script. To proceed use Continue or one of the appropriate Step controls; to finish, choose Stop. Do not alter the breakpoints of the already active Job in the meantime.
25. Stop after an asynchronous pause
The second test ended with Stop from the real PAUSED state. The supervisor terminated the Job as CANCELLED, without creating Datasets and removing the execution arrow. After closing the Debugger panel, the breakpoints become editable again. In our example the future diagnostic point was also removed, leaving the code clean.
26. State, revision and traceability
A complete Debug is recognised by the combination of Script reference, revision, SHA-256, Job and state. PAUSED documents a line actually reached and suspended; RUNNING means that statements can continue; COMPLETED and CANCELLED are two different terminal outcomes. The Job reports keep a copy of the source that was run. Debugger preferences and the text visible in the editor do not retroactively modify that copy.
27. Practical checks and troubleshooting
Before Start Debug, check Session, registered Script, unsaved changes and breakpoints. After Continue, observe the state and do not infer a stop from the mere click on Pause. If Pause does not produce PAUSED, use Stop to cancel in a managed way, or prepare a new Job with meaningful breakpoints. If the source is modified after saving, register the new revision and prepare Debug again. Detailed examination of Call Stack and Variables will be covered in the next chapter.
28. Returning to Python Script Workspace
Once the Jobs have ended and the Debugger panel is closed, reopen the source in the High Contrast Dark view. The Step, Continue and Pause controls have not rewritten the registered code. This guide showed the semantics of the buttons and the difference between a programmed interruption and an asynchronous suspension; the next guide will go into Call Stack, Locals, Globals and frame selection during PAUSED.