GX-TXT Python Script Workspace: breakpoints, source gutter and folding
In GX-TXT Python Script Workspace, the left margin of the code is not used only to show line numbers: it lets you insert and manage breakpoints, signals the line reached by the debugger and contains the chevrons for folding Python blocks. This guide illustrates the actual editor commands, the difference between an enabled and a disabled point, folding and the relationship between markers and registered revisions. The example code is synthetic and does not access physical instruments.
1. Preparing a readable Python source
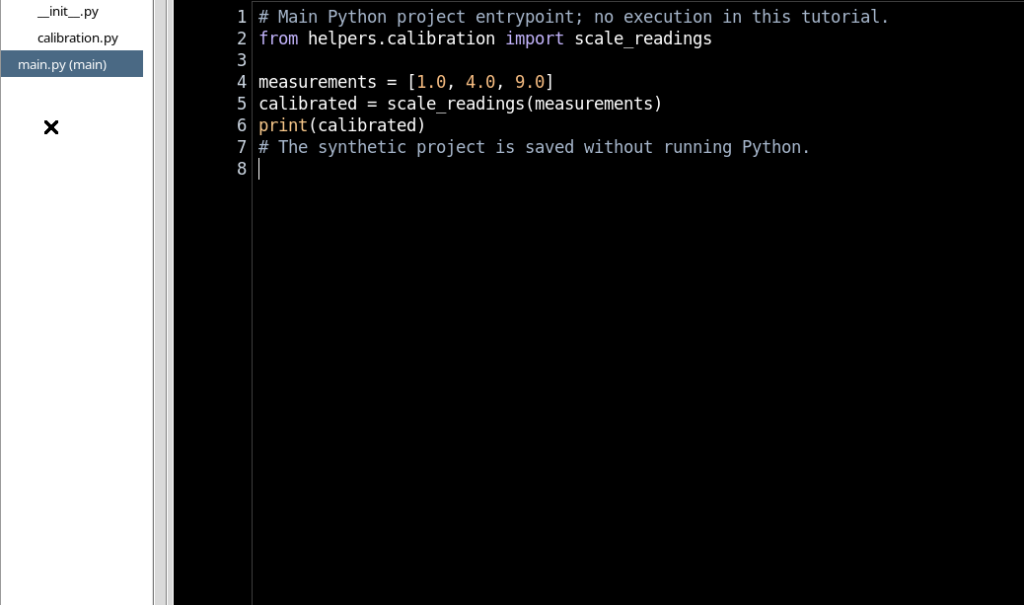
Open Python Script Workspace in the correct Session and select an already registered Script, or create one with File → New Script and File → Save. To explore the margin it is advisable to close unneeded panels, leaving mainly the code visible. The High Contrast Dark presentation keeps the text background black, highlights the Python statements and makes the markers in the side lane readable.
2. A small program suitable for the exercise
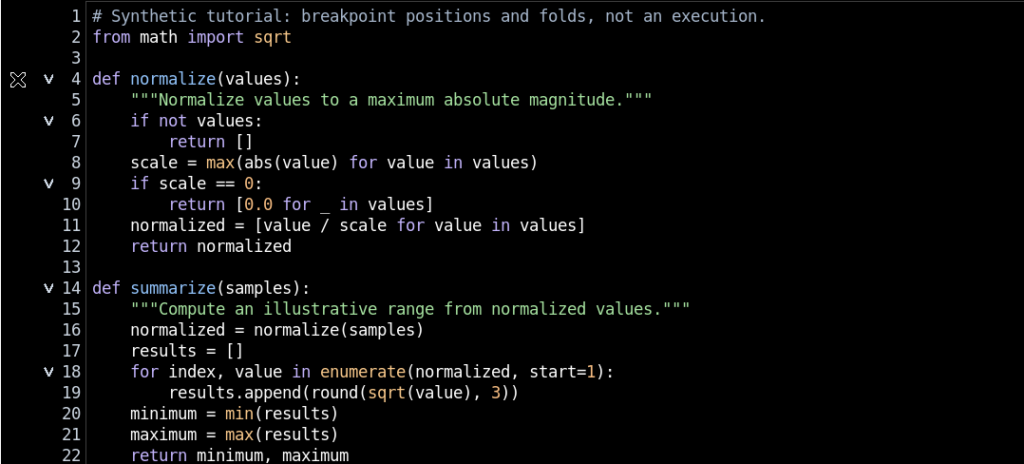
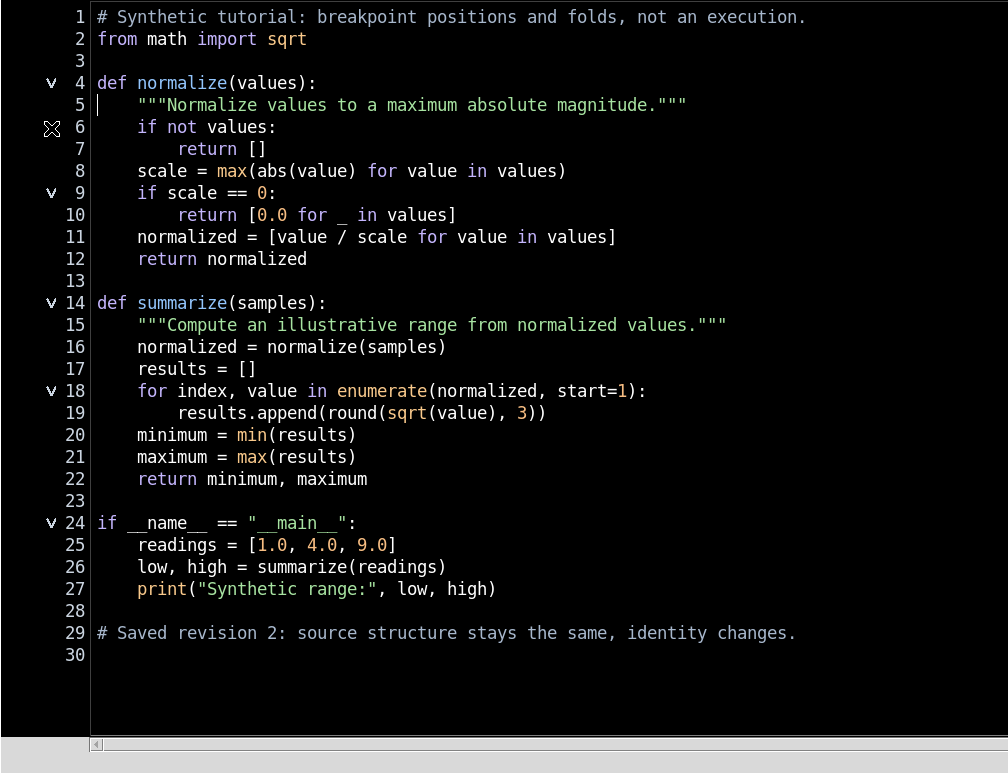
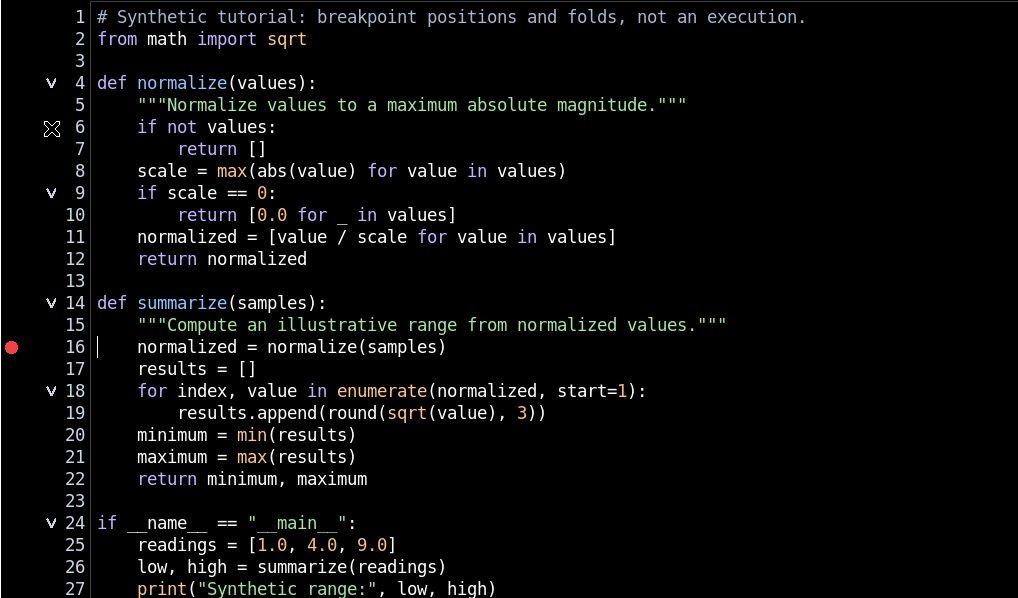
We use two Python functions: the first normalises a sequence of values and the second computes an illustrative range. There are definitions, conditions, a loop and executable statements on different lines. This lets you see both breakpoints and folding, without requiring numeric Datasets or scientific Jobs. The following excerpt shows the structure:
def normalize(values):
    # Return normalized synthetic values.
    scale = max(abs(value) for value in values)
    return [value / scale for value in values]

def summarize(samples):
    normalized = normalize(samples)
    results = []
    for value in normalized:
        results.append(round(value, 3))
    return min(results), max(results)
The comments in the source are in English; the statements describe only a teaching example.
3. The three lanes of the margin
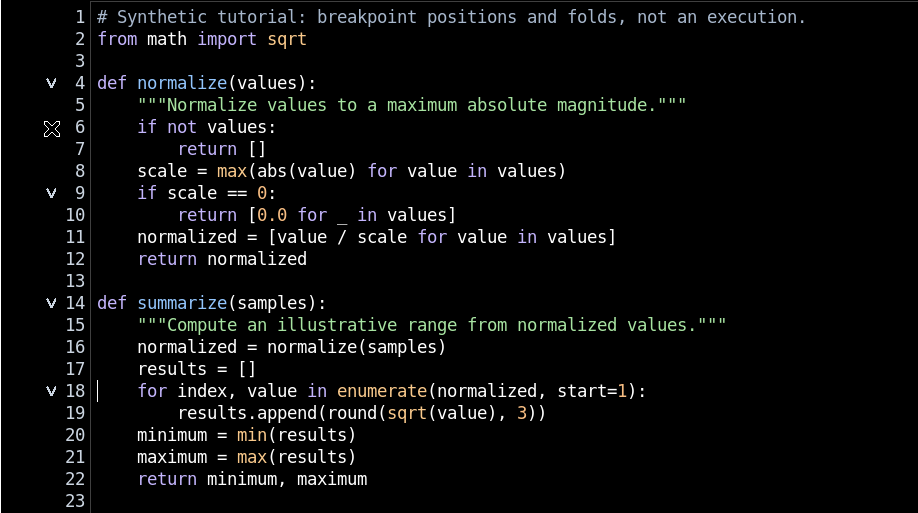
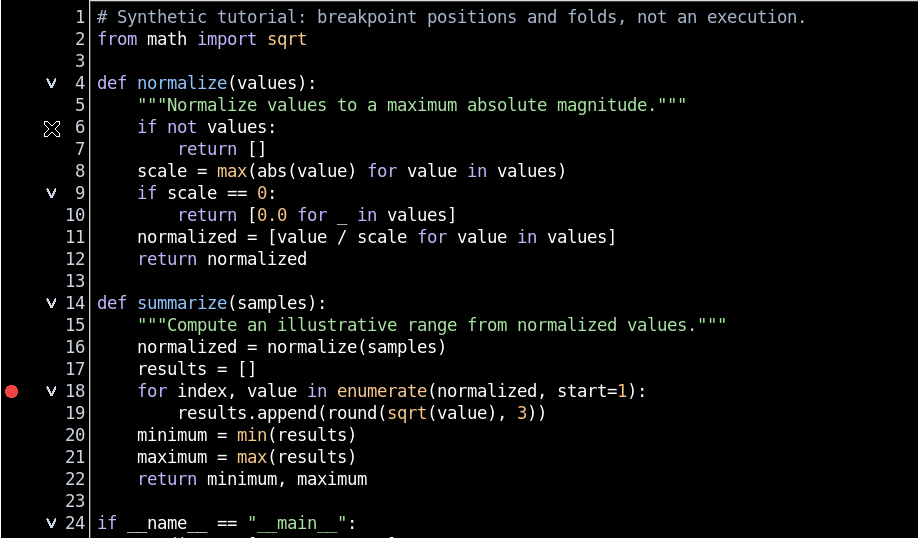
To the left of the numbering there are three different areas. The first hosts the breakpoints, normally identified by a red circle. The second is reserved for the indicator of the line being executed, represented by a yellow arrow when the debugger stops. The third shows the folding chevrons on the recognised blocks. These three signals can be close together, but have independent meanings.
4. The numbering identifies physical lines
A breakpoint corresponds to a physical line of the source, not to the apparent position after folding. The numbers displayed in the margin let you find the same statement even if other sections are temporarily hidden. Line numbers do not change when you use Fold current block or Fold all: the source text stays intact.
5. Inserting a breakpoint with F9
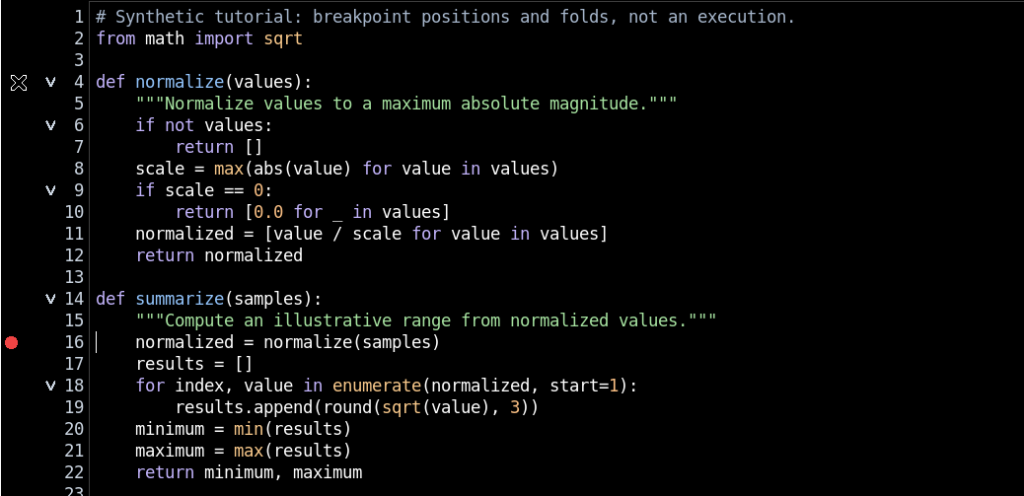
Move the cursor to a line containing an executable Python statement, such as the assignment normalized = normalize(samples), then press F9. The margin shows a red circle next to the line. In our example the chosen line is 16. The F9 key is a marker editing command: it does not run the function and does not create a Job by itself.
6. Adding a second point with the mouse
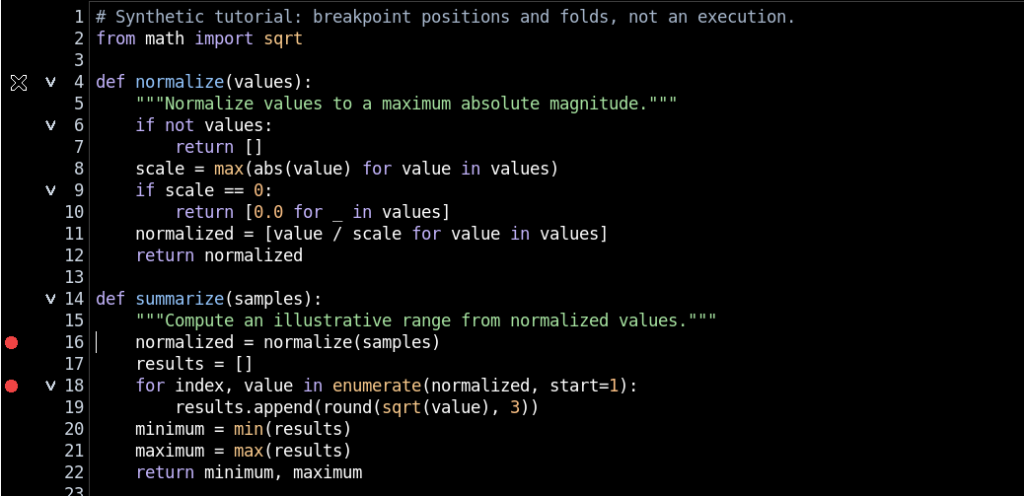
You can also create a point by clicking in the first lane of the margin next to an executable line. In the example, a click by line 18 adds a second breakpoint, independent of the one on line 16. The two red circles mean that both points are enabled. Returning to line 16 and pressing F9 again changes its state, removing it; a further F9 adds it again.
7. Non-executable lines are rejected
GX-TXT does not allow a breakpoint to be inserted on any line just because it contains text. An empty line, a comment or a docstring without an executable statement are rejected. The check uses the validated model of the Python structure; if a line has no executable statements, the editor shows a message in its status, without creating the point.
8. Waiting for the source model to be ready
Immediately after opening or editing, the editor may update its analysis of the source. If you try to insert a point while the structure is being updated, the command asks you to try again when the model is ready. This is not a provisionally accepted breakpoint: a point becomes valid only after the physical line has been checked. Therefore avoid repeated clicks while the syntax is being recalculated.
9. The margin context menu
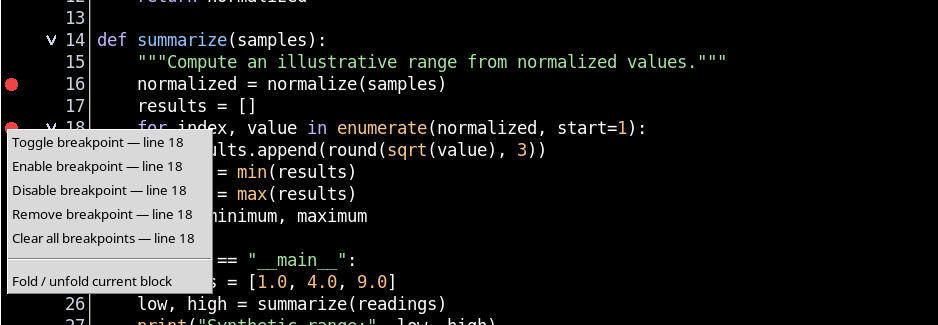
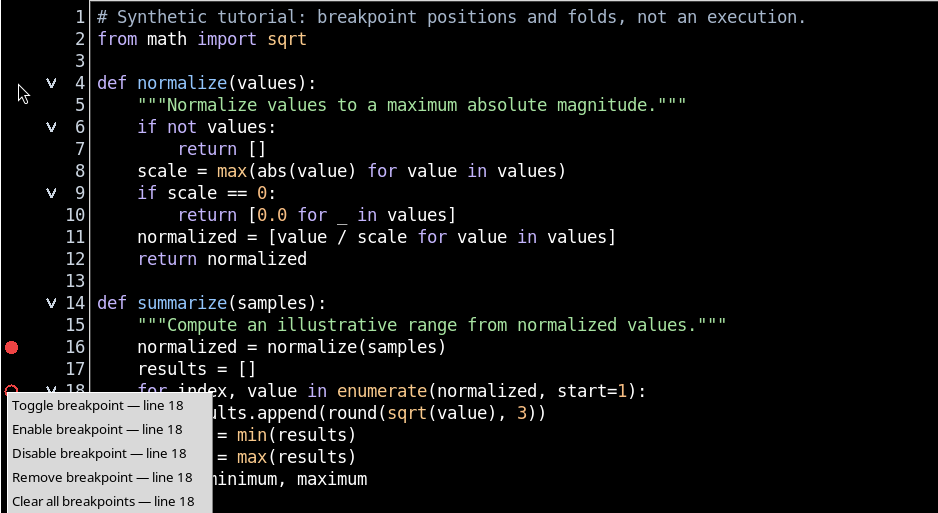
Right-click in the side lane of a line. The original menu includes Toggle breakpoint, Enable breakpoint, Disable breakpoint, Remove breakpoint, Clear all breakpoints and Fold / unfold current block. The actions act on the indicated line or on the whole set of breakpoints, depending on the command. The menu lets you manage them without modifying the Python text.
10. Disabling is not the same as removing
Disable breakpoint keeps the point on its line but makes it inactive. In the editor the symbol becomes a circle with only its outline, while enabled points remain filled. Enable breakpoint reactivates it, and Remove breakpoint deletes it. This distinction is useful when you want to temporarily suspend a stop condition without losing the reference to the line.
11. Opening the Breakpoints panel
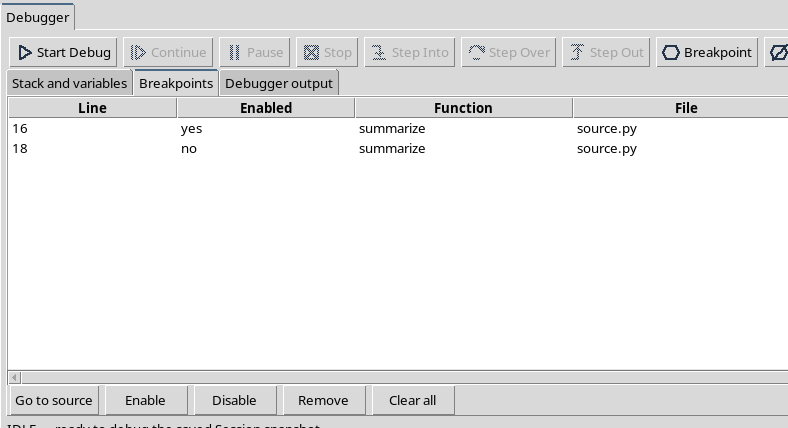
From the Run → Debug Session script… menu you can open the debugger panel without pressing Start Debug. Select the Breakpoints tab. In the IDLE state, the list shows the line, the Enabled state, the function, the source file, the registered reference and the SHA-256 revision. Open only this tab when you want to manage the points: Call Stack and Variables are not needed yet.
12. Navigating and re-enabling from the panel
By selecting a row of the list and pressing Go to source, the cursor returns to the corresponding statement in the file. You can also use Enable to reactivate a disabled point. In the example, line 18 goes from Enabled no to yes, while that of line 16 remains independent. Managing the panel in the IDLE state does not create executions.
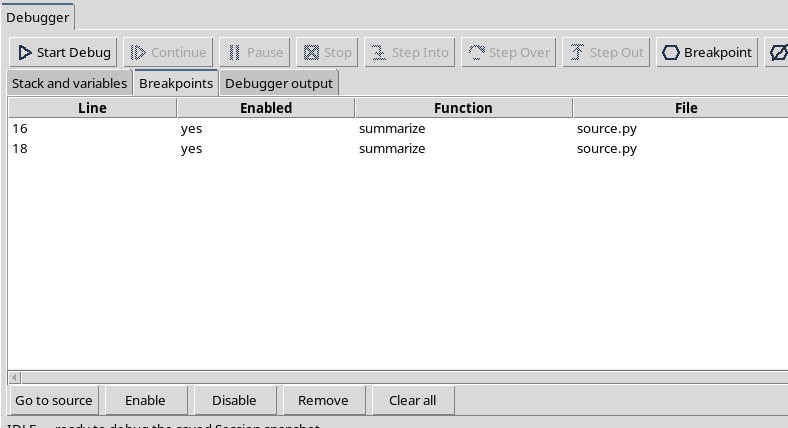
13. Remove and Clear all in the panel
The Remove button deletes only the selected point; the others remain in the list and in the margin. Clear all, instead, deletes the entire collection of enabled and disabled points of the document. Before deleting everything, check that you are working on the intended source. When the IDLE panel is closed, the editor returns to the normal code view.
14. Clearing all points from the keyboard
With focus on the code, Ctrl+Shift+F9 clears all breakpoints of the current source. The command is different from F9: it does not change only the point at the cursor, but empties the set of markers. The content of the Script, the semantic version and the saved SHA-256 are not modified by the command.
15. Why use folding
Folding lets you temporarily hide the inner lines of functions, conditions and loops, leaving the main points of the structure in view. It is not the same as deleting code, commenting out lines or changing indentation. It serves only to control how much of the source is visible, for example when you need to quickly locate another function.
16. Fold current block from the Edit menu
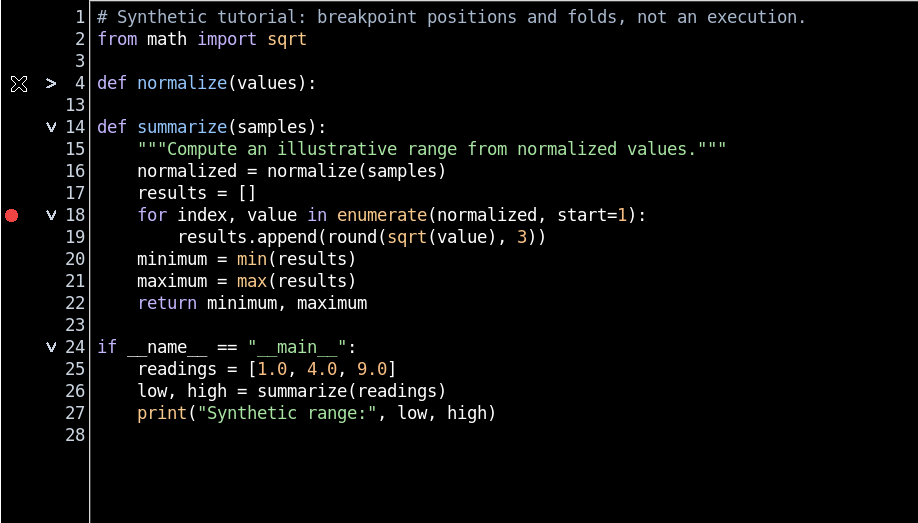
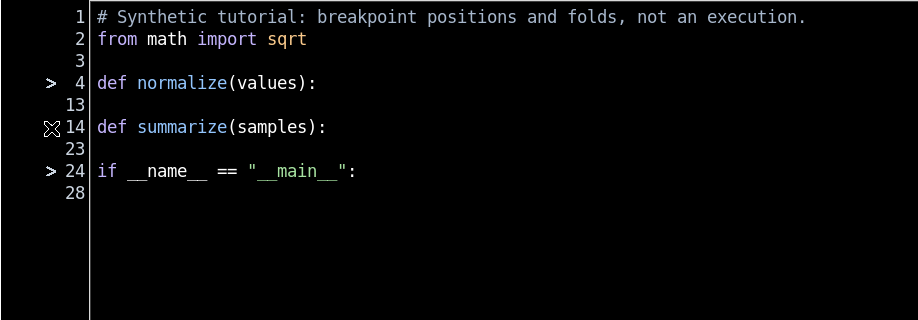
Place the cursor on the definition of a function and choose Edit → Fold current block. The body is folded and the margin shows a closed chevron. In the example, the function normalize remains visible on line 4, while the lines of its body are hidden and the numbering jumps directly to the following lines. No content is lost.
17. Using the chevron in the margin
The symbol in the third lane lets you fold or reopen a block without going through the menu. In our example a click on the definition of summarize also lets you close the second function. The chevrons identify the folding points recognised by the source model: not all line numbers have a symbol.
18. Fold all on the whole Python structure
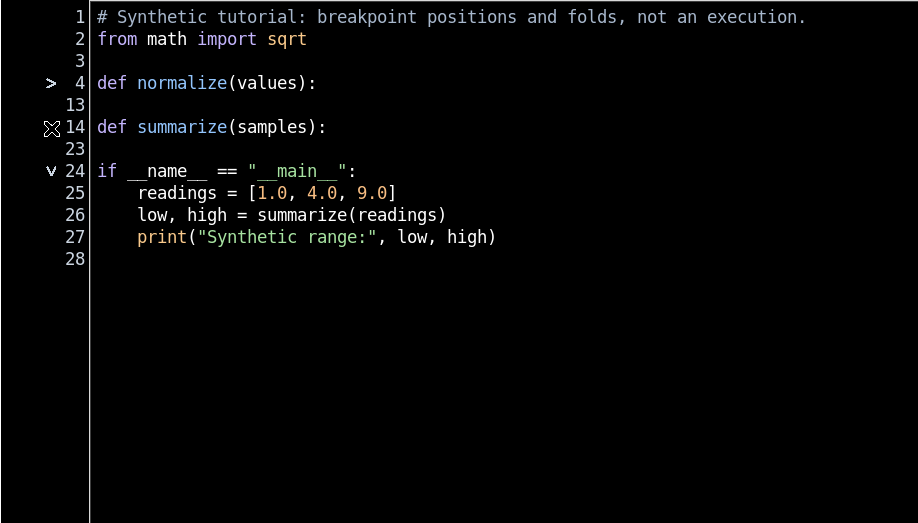
The Edit → Fold all command folds all available blocks. In the example the parser identified six foldable regions, including nested structures; when folding is applied, the overall view shows only the outermost headers. The view remains a complete Python document: the lines that are not visible continue to exist in the buffer.
19. Unfold all and return to the full view
Use Edit → Unfold all to remove all elisions and get the complete code back. The hidden lines return to the same physical positions, without a new revision or a new save. Even when a breakpoint is in the body of a folded function, it continues to refer to its physical line: folding does not move the point.
20. Breakpoints and folding are different properties
Breakpoints describe where to stop a possible execution; folding describes which parts to show in the editor. You can fold a function that contains a breakpoint, or open it without changing the points. A point that is not visible during folding must not be interpreted as a deleted point. To check the complete list you can open the Breakpoints tab.
21. Editing the code invalidates old points
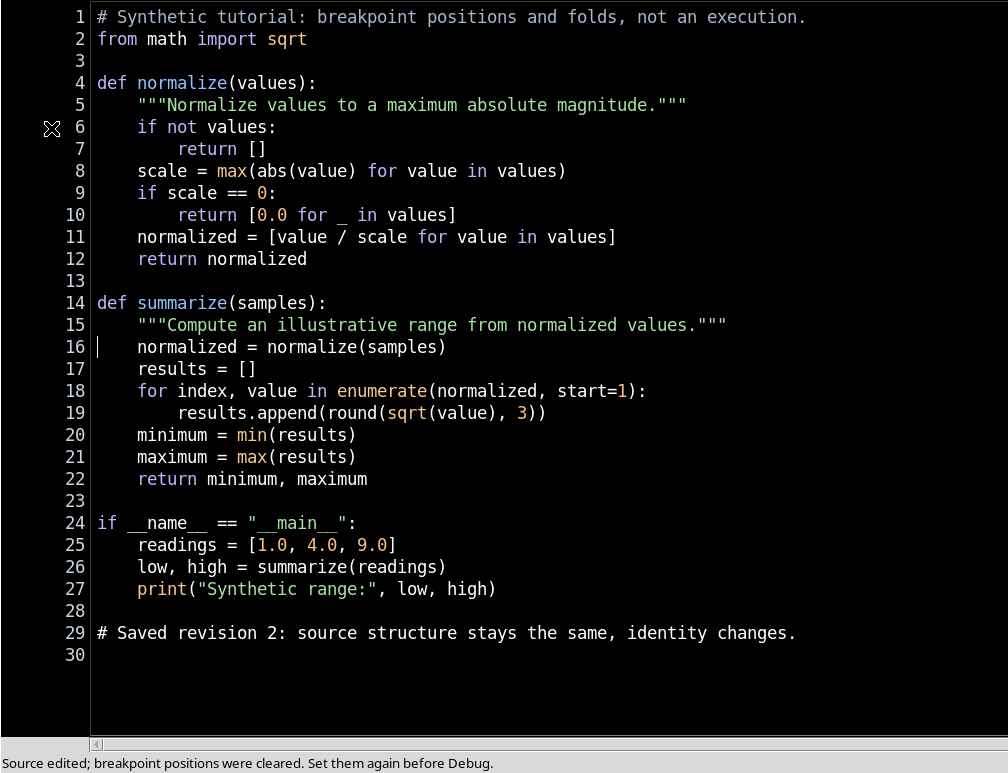
When the Python text is modified, the editor reports that the positions of the previous breakpoints have been cleared and must be re-examined. This behaviour prevents a point set on the old structure from being automatically associated with a different statement after editing. In the example a comment was added at the end of the source; the previously active point was not kept in the modified buffer.
22. Saving a different revision of the same Script
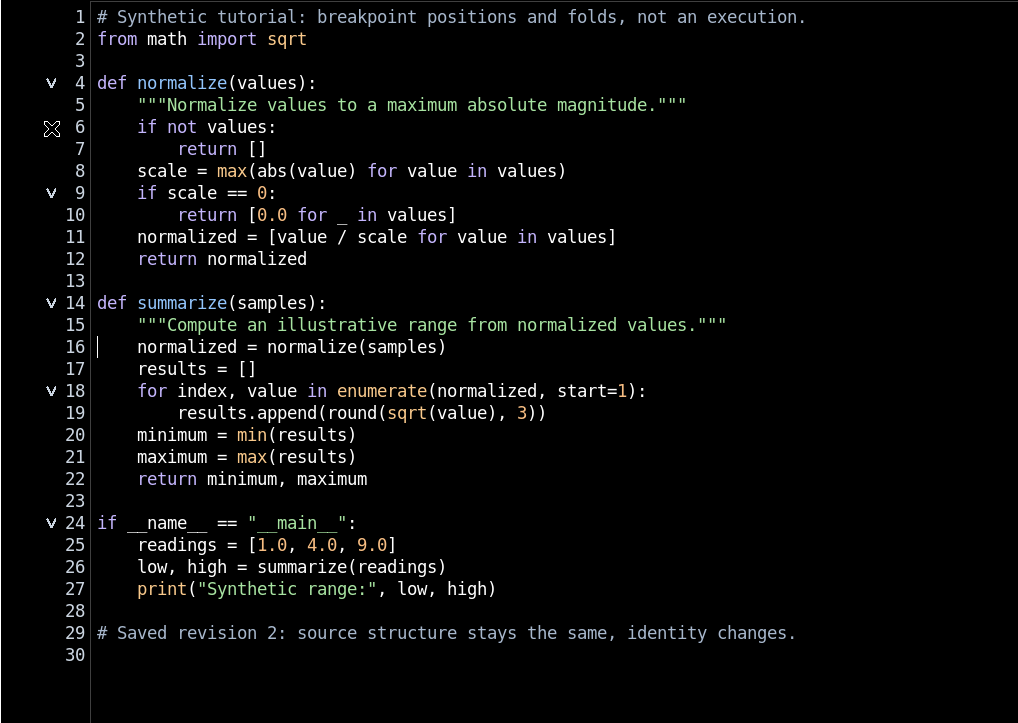
After the change, File → Save updates the registered revision and the SHA-256 of the source. Breakpoints are tied to the full identity of the document, not only to its name: the collection of the old revision is not automatically imported into the new one. You need to check the statements again and decide where to insert the appropriate points.
23. Setting new points in the updated revision
When the source of the new revision has been analysed, return to the desired line and press F9. The point just created refers to the current revision and its SHA-256, not to the previous one. GX-TXT keeps the revision references separate in the breakpoint configuration; this prevents two copies of the code that could have different contents from being treated as equivalent.
24. The meaning of the yellow arrow
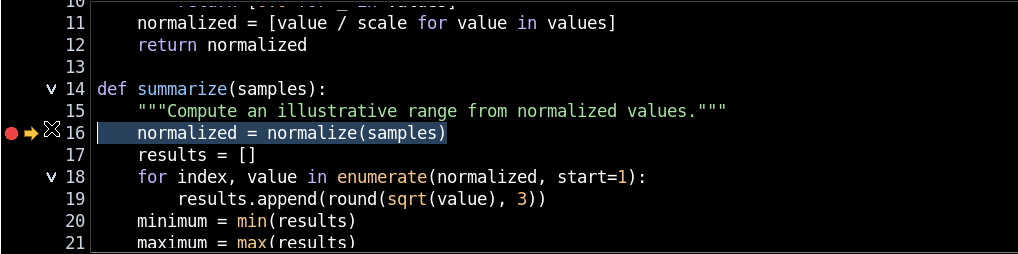
The second lane of the margin is reserved for the line reached by the debug execution. Unlike the red point, which represents a condition set by the user, the yellow arrow represents a position observed in the program. Before starting the debugger the arrow indicates no active execution: the mere presence of code or of a breakpoint is not enough to make it appear.
25. Checking a real stop on a breakpoint
To confirm the meaning of the indicator, you can start Start Debug on a Session Script that is already saved and clean. In a short real example, the debugger initially stopped on the first Python statement and, after Continue, stopped at line 16, where there was a valid breakpoint. The margin showed both red point and yellow arrow on the same line, with the source revision unchanged. The stepping commands and the state panels will be explained in the guide dedicated to the debugger.
26. Breakpoints cannot change during an active Debug
When the debugger is running or paused, the Job snapshot must remain immutable. The GUI prevents changing the breakpoints of that Job while it is active: to change the points you must first end the Debug session, check the code and prepare a new one. This protection keeps the observed markers, the registered revision and the source actually run consistent.
27. Stop, final state and closing the panel
The debugger’s Stop button stops the Job managed by the supervisor. In the case illustrated the test Job ended as CANCELLED, not as a normal completed processing run; it did not publish Datasets. When the Job reaches a terminal state, the execution arrow is removed and the breakpoints become manageable again. Then close the Debugger panel before continuing with editing. There is no need to manually kill Python processes.
28. Returning to the code and continuing with the debugger
Once the checks are complete, use Unfold all, remove the points no longer needed and return to the code view with superfluous panels closed. In the High Contrast Dark editor, the margin remains ready for a new set of breakpoints referring to the correct revision. This guide covered the markers and the structure of the source; the next one will examine in more detail Start Debug, Pause, Continue, Step Into, Step Over, Step Out and Stop using the native GX-TXT debugger.