GX-TXT Python Script Workspace: Call Stack, Locals, Globals and helper file frames
The GX-TXT native Python debugger lets you examine the chain of calls and the values of the variables while a Job is actually PAUSED. In the Stack and variables tab you can select different frames to learn the context of the calling functions, distinguishing the actual position of the interpreter from the position of the frame being observed. This guide uses a Session Python Project with an entrypoint and a helper file, without physical instruments or scientific Datasets.
1. Why use Call Stack
When a program calls several functions, a single file or a single highlighted line is not enough to understand how a computation was reached. The Call Stack indicates which functions are active and which called each other. Locals / Globals shows the values of the selected frame, not necessarily those of the innermost frame. The GUI keeps a verified reference to the registered source and to the current Job, to avoid mixing data from different revisions.
2. Preparing a Session Python Project
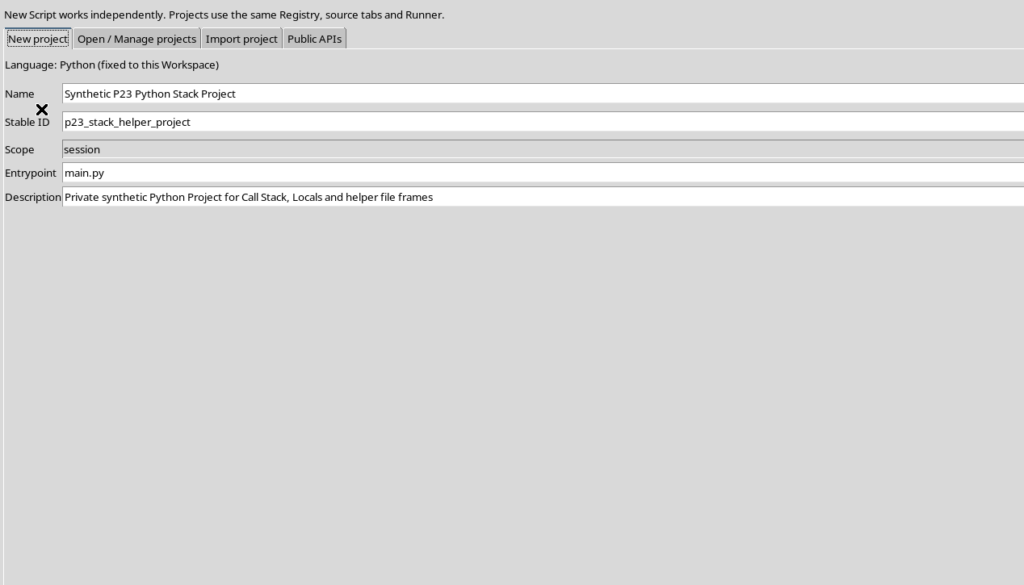
In Python Script Workspace, choose Project → New Project… and fill in name, identifier, Scope: Session and Entrypoint: main.py. A Project contains several source files but is managed by a single registered identity. The new teaching Project serves only to show the passage between an entrypoint and a helper. There is no need to open the Script Library.
3. Adding the helper file
From the open Project, use Project → New file… and enter a relative path, for example helpers/numeric.py. The original dialog accepts a name internal to the Project and registers the new file in the same set of sources. Do not replace this relative path with an arbitrary file outside the Session: the debugger must be able to verify that each frame belongs to the files allowed by the Project revision.
4. A function with synthetic scientific variables
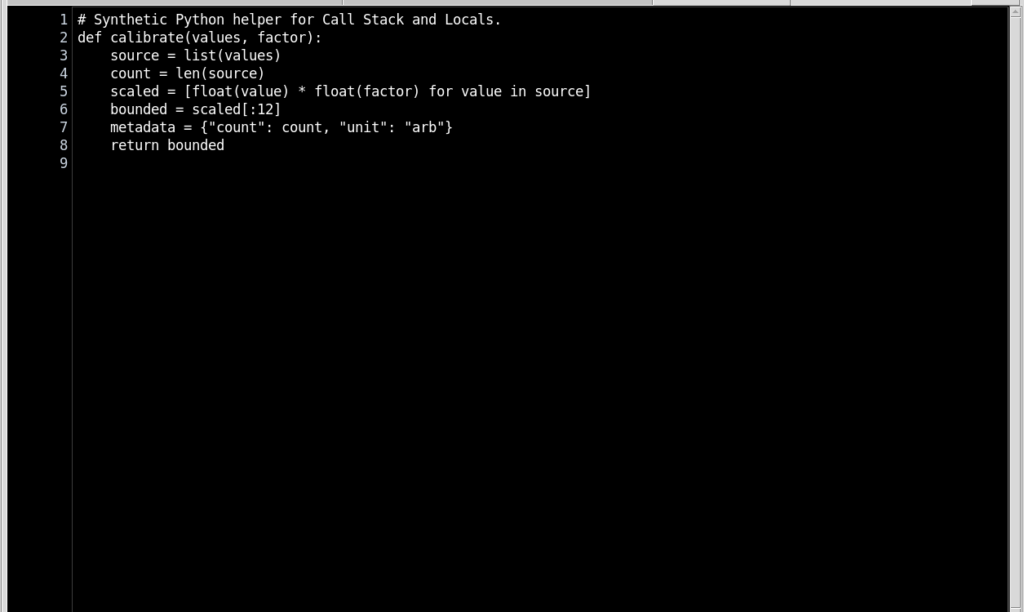
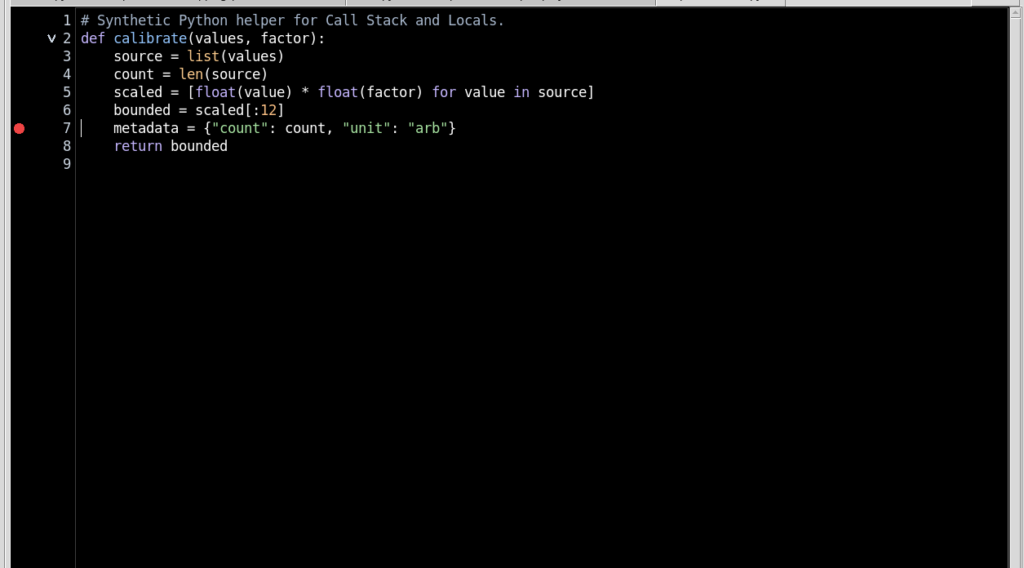
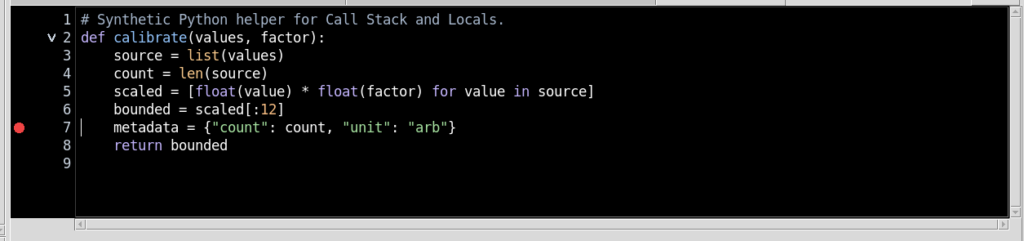
In the helper file, we define calibrate, which receives three values and a numeric factor. During the computation it creates a temporary list, its length, a second list with rescaled values and a small dict structure. These objects let you observe types and sizes in the debugger.
def calibrate(values, factor):
    source = list(values)
    count = len(source)
    scaled = [float(value) * float(factor) for value in source]
    bounded = scaled[:12]
    metadata = {"count": count, "unit": "arb"}
    return bounded
The data are invented and do not constitute an experimental calibration.
5. The entrypoint imports the helper file
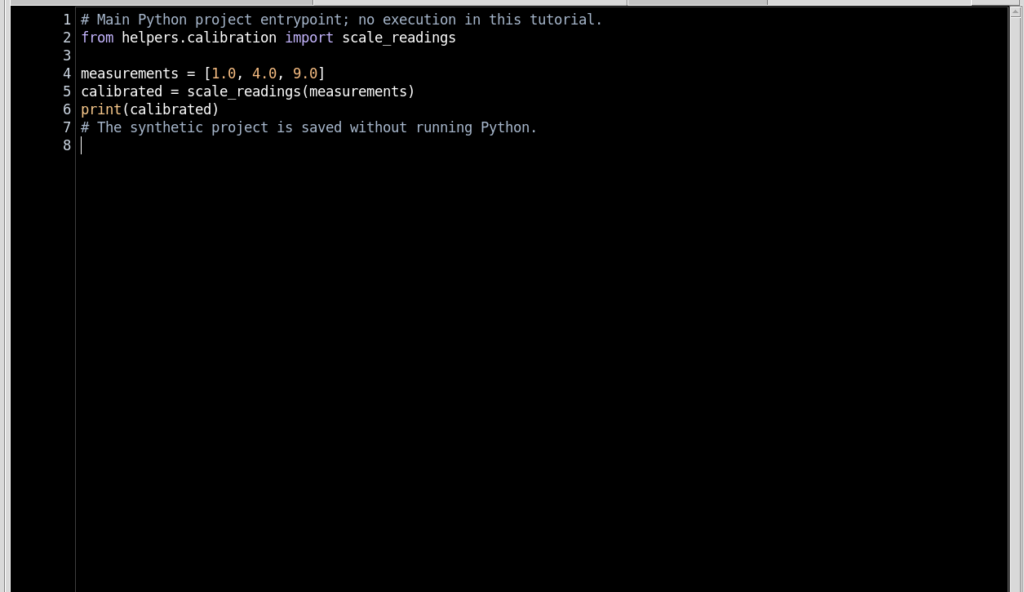
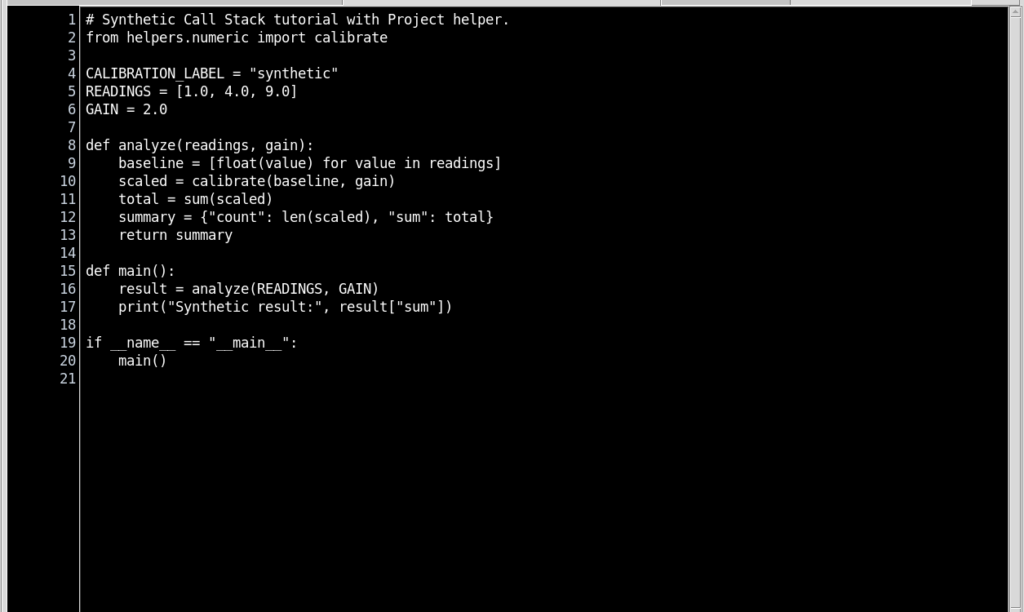
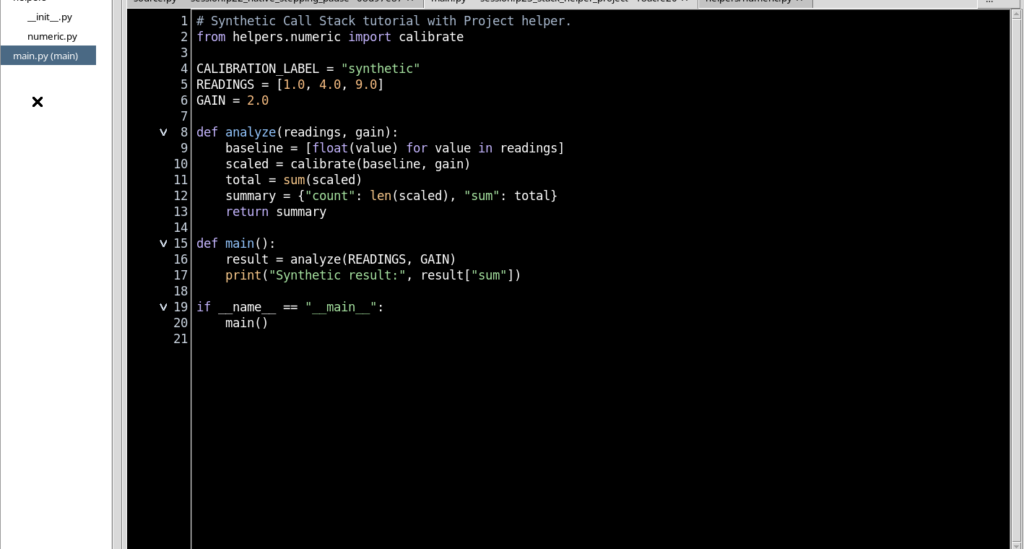
In the file main.py, import the function with from helpers.numeric import calibrate. The function analyze creates baseline, calls the helper and builds a summary. The function main calls analyze with three samples and a factor. The global values CALIBRATION_LABEL, READINGS and GAIN remain available in the entrypoint module.
6. Saving the Project files together
Also add helpers/__init__.py, then use File → Save All to register the Project buffers. The three files become part of the same revision and of its overall SHA-256. The single Debug Job will run that revision, not a combination of old and new versions of the helper.
7. The difference between a single Script and a Project
A Script registered as a single file normally presents the frames belonging to that source. A Python Project, instead, can also admit the frames of helper files registered in the same revision. The Debugger does not indiscriminately treat all the code of the Python standard library as files of the experiment: it filters the chain of frames according to the files allowed by the Project manifest.
8. Setting a breakpoint in the helper
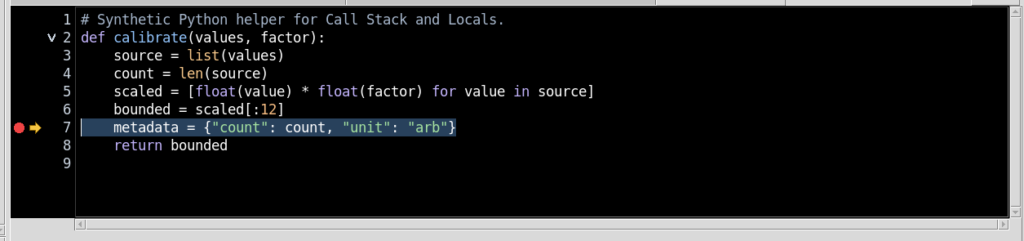
In the Project tree select helpers/numeric.py. Move the cursor to executable line 7, where metadata is prepared, and press F9. The red point must appear in the margin of the helper file and remain associated with that file, not with line 7 of main.py. A Project breakpoint is therefore identified by file and line, as well as by the source revision.
9. Deliberately opening Stack and variables
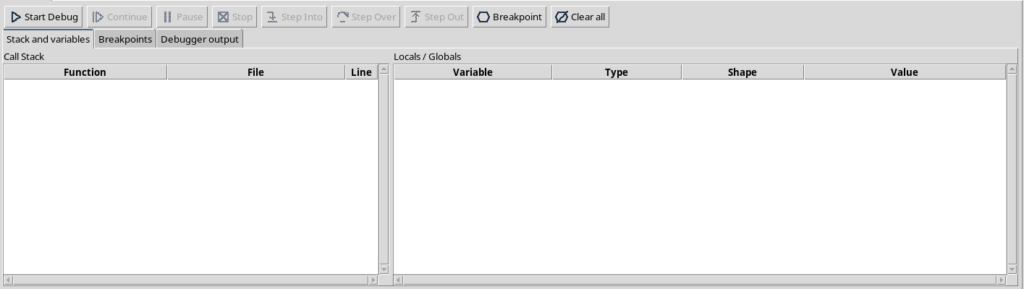
Choose Run → Debug Session script…, then open the Stack and variables tab. For this chapter both views are useful: Call Stack on the left and Locals / Globals on the right. In everyday editing operations it is instead preferable to leave these panels closed, so as to keep more space for the code.
10. Start Debug and the initial pause
Press Start Debug on the saved, clean Project. As in the previous guide, the Python debugger may make a first suspension on the first statement of the entrypoint, before the call to the helper. The Stack tab is populated as the Job reaches the stopping points. The Start Debug button creates a real Job managed by the supervisor; opening the IDLE panel alone does not create it.
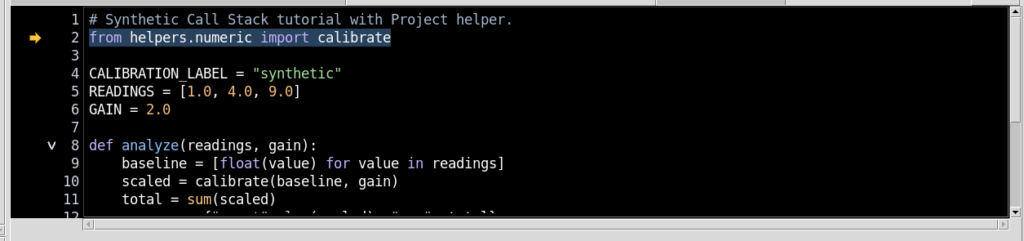
11. Continue up to the helper breakpoint
Press Continue. The program runs main, passes to analyze and calls calibrate from the file helpers/numeric.py. Execution stops on line 7 of the helper with state PAUSED. GX-TXT brings the corresponding registered file to the foreground and draws the yellow arrow next to the red breakpoint.
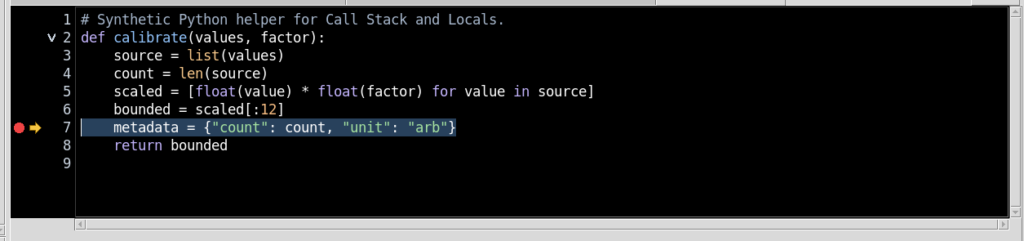
12. The four frames actually observed
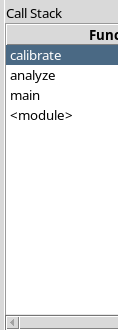
The Call Stack presents this sequence of active functions, from the innermost to the outermost:
| Frame | Function | File | Line |
|---|---|---|---|
| 0 | calibrate | helpers/numeric.py | 7 |
| 1 | analyze | main.py | 10 |
| 2 | main | main.py | 16 |
| 3 | <module> | main.py | 20 |
Frame 0 is the one in which the interpreter is actually stopped. The following ones describe the calls that led to that point. The line numbers represent the positions in the respective files of the revision that was run.
13. Locals in the calibrate frame
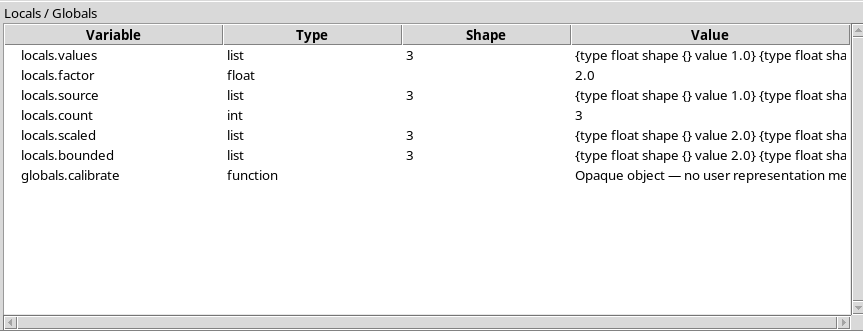
When frame 0 is selected, the Locals include values, factor, source, count, scaled and bounded. In the observed pause, factor is a float with value 2.0, count is an int with value 3, while scaled is a list of length 3 containing 2.0, 8.0, 18.0. The variable metadata is not yet assigned, because the interpreter is stopped before its line is executed.
14. Selecting the calling frame analyze
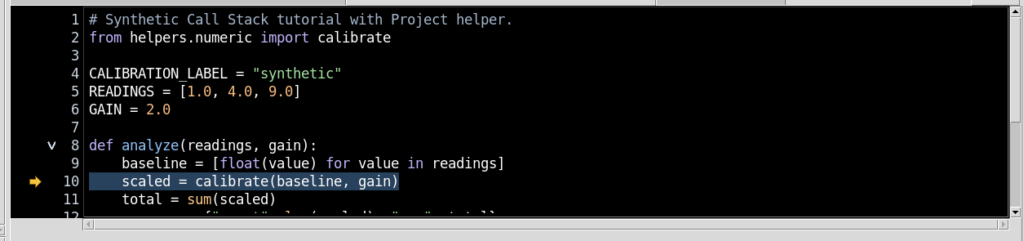
Click the analyze row in the Call Stack. GX-TXT selects frame 1 and opens main.py at line 10, where the call calibrate(baseline, gain) is located. This is an inspection step, not an execution step: it is not the same as Step Out, it does not modify the variables and it does not make Python continue.
15. The Locals change with the selected frame
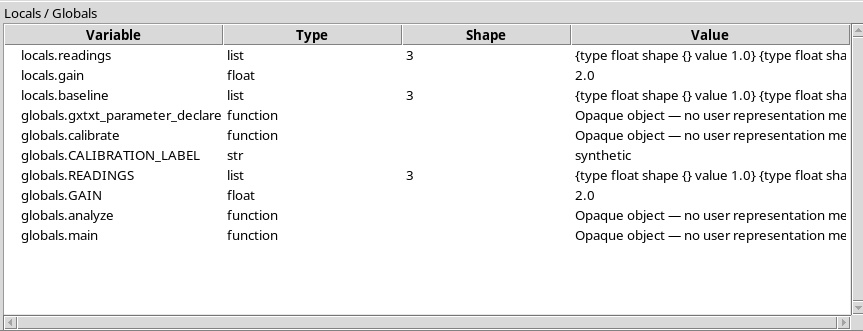
In the analyze frame, the value gain is 2.0, and baseline contains the three synthetic inputs in a list of shape 3. The local variable scaled is not yet present, because the call to the helper has not yet returned its result. Comparing this panel with the Locals of the calibrate frame lets you understand which assignments have already been executed in each function.
16. The main frame and the global variables
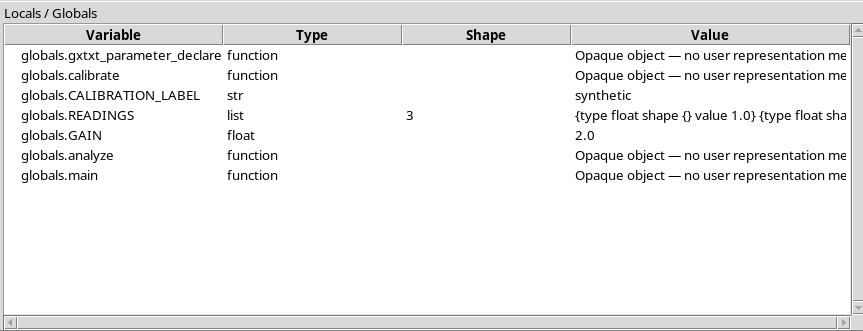
When frame 2 is selected, the context active for inspection becomes main at line 16. The global variables of the file main.py include CALIBRATION_LABEL, with type str and value synthetic, and READINGS, a list of three numbers. A Global belongs to the module of the selected frame: when switching from main.py to the helper, the Globals dictionary can also be different.
17. What Type, Shape and Value indicate
The Locals / Globals panel distinguishes the name of the variable from the Type, the Shape and the Value. float and int are scalar numeric values; a list can report a shape with the number of elements, and a dict the number of pairs present. The text displayed is not necessarily a complete serialisation of the Python object: it serves to describe the available snapshot in a limited and safe way.
18. Returning to frame 0
Click calibrate again in the Call Stack table. The active file returns to helpers/numeric.py, the selected position returns to line 7 and the Locals of the helper function reappear. The interpreter remained stopped at the same point throughout the navigation: switching between frames does not execute any new statement.
19. Selected frame and actual position of the interpreter
In the native snapshot, GX-TXT keeps separately selected_frame, file and line of the observed frame, as well as execution_file and execution_line of the line actually suspended. When you select analyze, the panel shows main.py at line 10, but execution remains in calibrate at line 7. This detail is fundamental: the line shown after a selection does not prove that the Job has executed a Step command.
20. The relationship between imports and Project files
The helper is admitted in Debug because it belongs to the registered manifest of the Project. The code from helpers.numeric import calibrate links the entrypoint to the package. When the debugger stops in the helper, the tab of the corresponding file can be opened automatically. Not all technical frames of the Python standard library are included among the user frames of the Project: the list is limited to the sources recognised by the contract.
21. The observations are limited, not a Python console
The debugger must not run arbitrary repr() or str() on the researcher’s objects to build an inspector. Simple values can be shown directly; lists and dictionaries are represented in limited form and complex objects are indicated as opaque. In the example, a function is presented as an opaque object instead of invoking its representation. This behaviour reduces side effects and keeps inspection more predictable.
22. Length and depth limits
The native representation limits the number of variables and the elements displayed: for example, reading Locals and Globals considers at most 128 entries per scope, a list shows up to 12 elements and strings are truncated to a defined maximum length. Deeper nested levels may be omitted. These limits apply to the inspector snapshot, not to the actual size of the scientific structures used by the program.
23. Why Shape does not always coincide with the total number of data
For a simple Python list the shape 3 indicates three elements. For a NumPy array, instead, the shape can have several dimensions and the inspector can also show the dtype. The values reported in the panel are only a limited preview and do not replace a complete scientific publication with canonical Dataset, units, uncertainties and metadata. Use the snapshot to understand the flow of the code, not to export measurements.
24. During PAUSED the variables represent a snapshot
The inspector rows are values observed when the Job is suspended, referring to the revision of the Script and to the selected frame. If you press Continue or one of the Step commands, the program can modify those values: you need to wait for a new suspension to read them again. After an exception, the debugger can distinguish the last PAUSED view from data already gone from the stack. Do not assume that a variable shown after a terminal event is still a live value of the process.
25. Frame selection does not allow altering the Job
The Call Stack table lets you examine and navigate frames; it is not an editor of the process variables. The Debugger’s frame control requires a valid index and the same Job/SHA-256 already verified. It is not equivalent to changing the entrypoint, modifying the Python file or moving the execution pointer. To change the computation you need to work on the source, save a new revision of it and start another Job.
26. Ending the exercise with Stop
Once inspection is finished, press Stop. The GX-TXT supervisor stops the managed Job; in the exercise the terminal result is CANCELLED, not COMPLETED. The GUI removes the execution arrow and closes the observation tools when the Debugger panel is closed. Handling Stop does not modify the registered Project and does not publish results Datasets.
27. Checking provenance and revisions
A reliable observation identifies the Project, its SHA-256, the Job and the files of the revision actually run. The entrypoint and the helpers are copied into the immutable context of the Job. If the Project later changes, the old Call Stack remains a historical record of that execution; it must not be compared directly with lines and file names of a different revision without checking their content.
28. Returning to the normal Workspace
Close the Debugger and bring the editor back to the original code in High Contrast Dark, with the Call Stack and Locals / Globals panels closed to leave room for the source. The guide showed how to move from a helper to the caller without advancing the Job and how to read Type, Shape and Value with safety limits. The next chapter will examine Python exceptions, cancellations and protections against stale revisions.