GX-TXT Python Script Workspace: stdout, stderr, diagnostic logs and full streams
Every Python execution in GX-TXT produces a Job with a persistent identity and, when the program writes messages, several streams that can be consulted even after completion. Program output, Program stderr, Diagnostic log and Legacy combined stream are not interchangeable. Script Jobs Manager shows only a limited preview; the Execution details window instead lets you read, copy and export the selected stream, even when it exceeds a single page.
1. Why distinguish the output channels
In scientific work it is important to separate the numbers produced by the Script, the error messages and the information generated by the execution system. A message on stderr does not necessarily mean that the Job has failed; the official state is kept by the supervisor. Likewise, reading a few lines of the panel is not the same as having the whole log file.
2. A Python example without external instruments
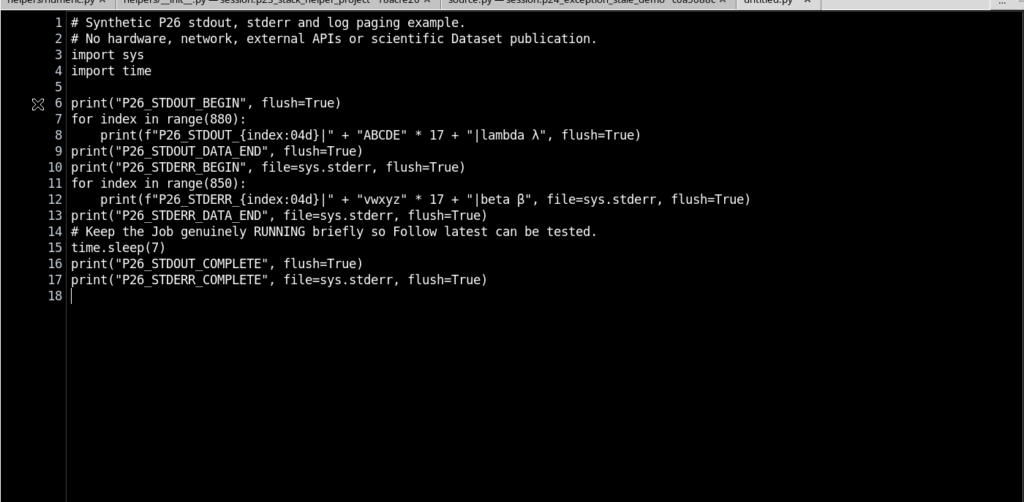
Create a Python Script in the Session, using exclusively synthetic data. The example sends numbered lines and text to stdout and stderr, without accessing physical instruments, the network or the experiment’s Datasets. Write the comments in the code in English and save the Script before creating a Job.
3. Writing to stdout and stderr
The Python module sys exposes the standard channels. The print function normally writes to stdout; with file=sys.stderr the text is directed to the second channel.
import sys

print("Measurement summary: synthetic", flush=True)
print("Warning: demonstration only", file=sys.stderr, flush=True)
The flush=True option asks Python to flush its buffer after writing. However, it is not a guarantee that all data appear immediately in the interface during an active Job: the collection and updating of the logs by the supervisor also come into play.
4. Registering the source before execution
Use File → Save and check that the buffer contains no unsaved changes. GX-TXT associates the revision and the SHA-256 of the source with the Script. When the Job is submitted, the executed snapshot will remain linked to that revision, even if the editor is subsequently modified.
5. Validate review and Run Job are different operations
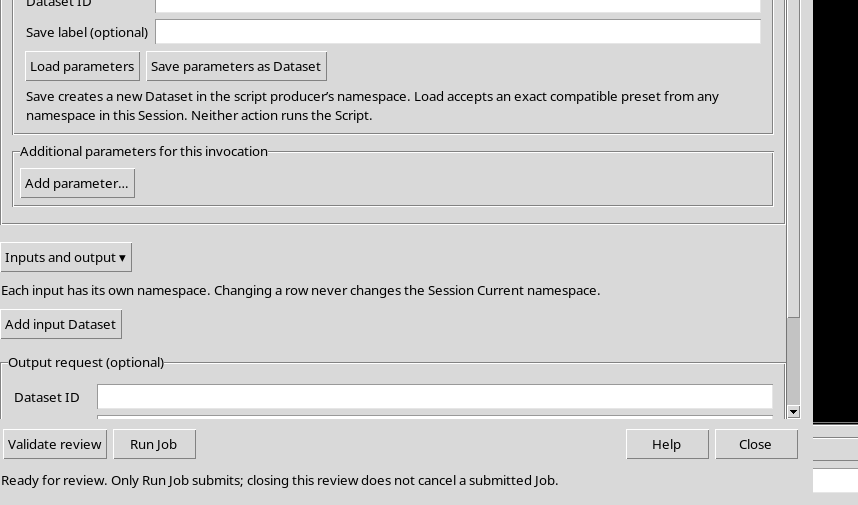
Open the Runner of the saved Script. Validate review checks the request without creating Jobs. Only Run Job submits the execution to the supervisor. For the stream test no scientific parameters, input Datasets or publication requests are needed. The example must remain a normal local Job of the selected Session.
6. The Job state remains independent of the messages
A program can write to both channels and end normally. In the observed example, the Job is COMPLETED, with exit code 0, despite having produced a long stderr. The presence of diagnostic text does not replace checking the state, origin, revision and any exit code of the Job.
7. Opening the stored execution
From Script Jobs Manager select the Job and enter Open execution details. The panel presents the reference to the Script, the identity of the single execution, the snapshot validation and the state information. In this guide consultation of an already registered local Job is used; the Reconnect command reloads the same execution and does not restart it.
8. The controls of the Execution details window
The original bar offers Reconnect, access to the source files, copying of identifiers and details, Copy selection, Select visible page, Copy entire source and Save source to file…. The stream selector is in the same area. The text of the Copy entire source button must be interpreted in the context of the window: when consulting the logs, it copies the whole currently selected stream, not necessarily the registered Python source.

9. Program output: the stdout channel
Select Program output in the channels menu. This view shows the text that the program sent to stdout. In the example there are start markers, many numbered lines and an end marker, useful to recognise whether the consultation covers the whole file or only a part.
10. The window reads 64 KiB pages
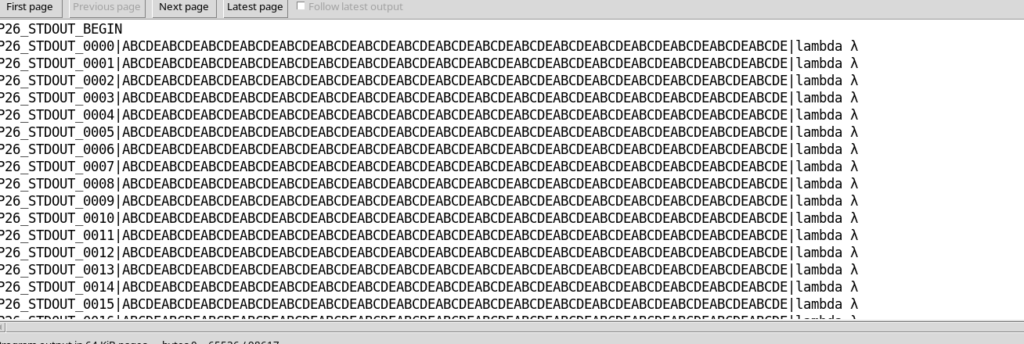
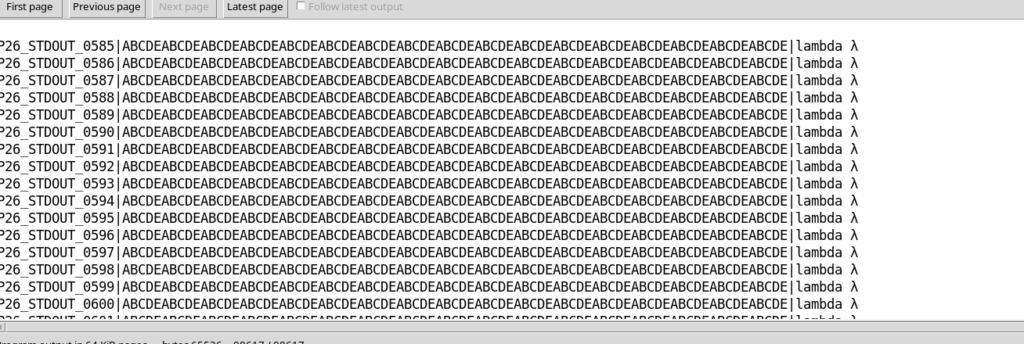
Long data are not loaded in full into the visible page. Execution details uses ranges of at most 65,536 bytes, corresponding to 64 KiB. In a stdout of 98,617 bytes, the first page contains bytes 0 to 65,536. To reach the rest you need the Next page button.
11. Moving to the second page of stdout
Click Next page. In the test the second range of stdout goes from byte 65,536 to byte 98,617. The Previous page button lets you return to the first range. This navigation does not modify the file: it only changes the portion displayed in the pane.
12. Reading the offsets in the status bar
The lower bar of Execution details shows the name of the channel and an indication similar to bytes 65536 .. 98617 / 98617. The first number is the start of the page, the second the limit reached and the last the total size of the stream. Do not confuse the number of visible characters with bytes: accented letters and UTF-8 symbols can occupy more than one byte.

13. Program stderr: a second stream
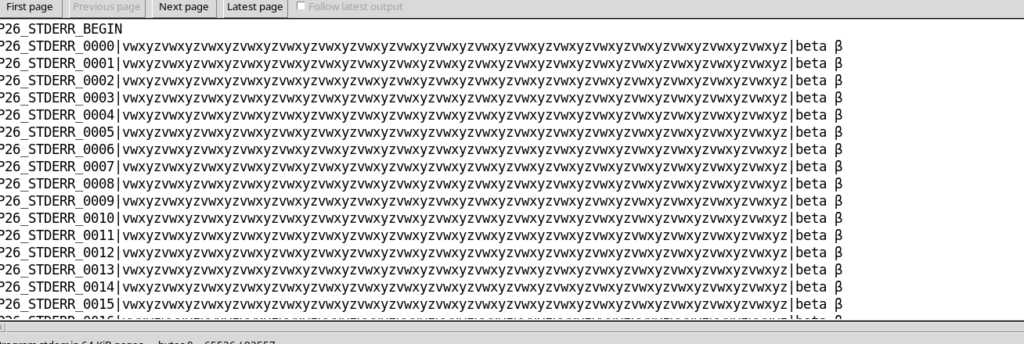
From the selector choose Program stderr. The pane shows the lines sent by Python to sys.stderr, distinct from the results printed on the normal stdout. In the example the stderr file contains 93,557 bytes, so it too exceeds the capacity of the first page.
14. stderr also has several pages
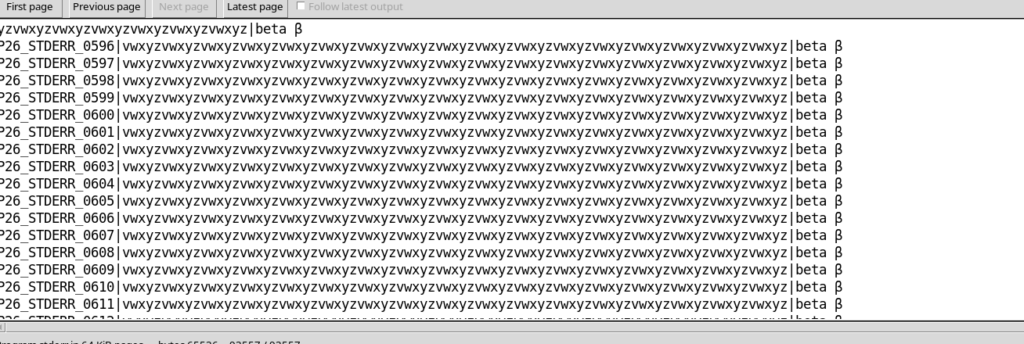
Use Next page to display the second range of stderr. The bytes of the second page go from 65,536 to 93,557. If you select another channel and then return to stderr, check the offsets again: the content shown must be attributed to the channel and range actually selected.
15. Writing to stderr is not the same as raising an exception
The Script can send warnings or informational messages to stderr without stopping. An unhandled Python exception typically produces a traceback in the same channel, but the distinction between COMPLETED and FAILED derives from the terminal state of the Job. To reconstruct an error it is therefore necessary to read stderr, the execution report and the exit code together.
16. Diagnostic log: the execution diary
Select Diagnostic log to consult the supervisor’s diagnostic channel. It is not a copy of stderr: it can contain events and information relating to the admission, start or completion of the Job. It is also different from the numeric output of the program, which continues to reside in its own stream.

17. The diagnostic log has its own size
In the test the Diagnostic log occupies 519 bytes, compared with the 98,617 bytes of stdout and the 93,557 bytes of stderr. The status bar therefore displays a range from 0 to 519 of 519. The difference in size is a practical confirmation that the channels are stored and consulted separately.

18. Legacy combined stream: another channel
The Legacy combined stream entry lets you consult the combined stream kept by the execution. It can be useful to compare the historical consultation of logs with the one separated by role. Do not assume that its offsets correspond to the offsets of stdout or stderr: the combined stream has its own byte sequence and its own size.

19. Paginating a stream longer than 128 KiB
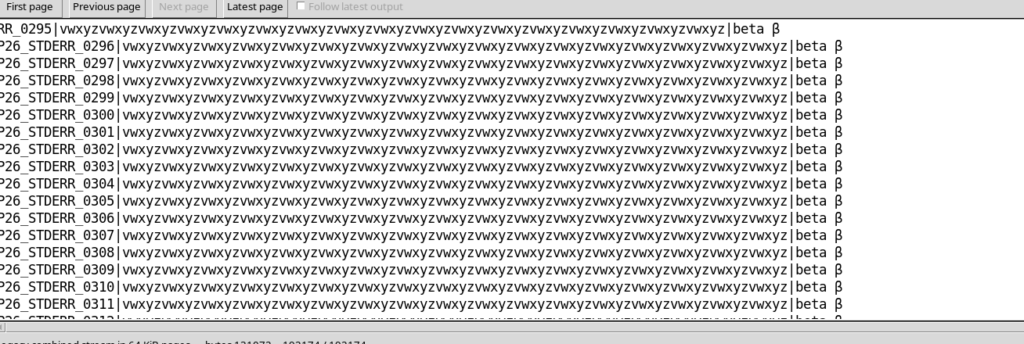
The combined stream of the example occupies 192,174 bytes. The first page covers bytes 0–65,536, the second 65,536–131,072 and the third 131,072–192,174. In this case two clicks on Next page are needed to reach the final part. The First page and Previous page buttons go back without altering the content.
20. Latest page does not mean complete stream
The Latest page button requests the final part of the stream. On a file of 192,174 bytes and a range of 65,536 bytes, the view starts from byte 126,638 and ends at 192,174. In other words, it shows the last 64 KiB: it is a quick navigation function, not a complete export.

21. The Script Jobs Manager preview is even shorter
Script Jobs Manager offers a preview limited to 16 KiB of the selected log. In Execution details the displayable pages instead reach 64 KiB. Neither of these two limits indicates that the underlying file has necessarily been truncated. To assess whether you have all the content you need to compare the offsets, the total size and, when necessary, use the complete export.
22. Select visible page selects only the displayed text
The Select visible page button selects the content currently displayed in the log widget. Copy selection can then copy that portion to the clipboard. If the page is the second of a long stream, the operation does not automatically include the first page. It is useful for sharing a precise excerpt, not for archiving the whole execution.
23. Copy entire source transfers the whole selected stream
To copy the complete log file, use Copy entire source in the details window. Although its label mentions source, when the selector is set to Program output or Program stderr the command transfers the chosen stream across all pages. In the example the complete transfer of stdout and stderr contains 98,617 and 93,557 bytes respectively, and does not stop at the single 65,536-byte page.
24. Save source to file… and complete export
The Save source to file… button lets you choose a path for the content of the selected stream. Use a destination distinct from the internal scientific folder of the Session, to avoid altering the files that document the Job. The complete export of the example was compared with the original files of stdout, stderr, Diagnostic log and Legacy combined stream: the SHA-256 values match. For an extended log, checking the bytes is more reliable than a simple visual comparison of a few lines.
25. UTF-8 characters and page limits
Greek letters such as λ and β also appear in the test streams. A UTF-8 character can require several bytes, so a 65,536-byte page does not necessarily contain 65,536 visible characters. When copying or saving scientific logs, it is important to preserve the encoding without manually reconstructing the content from the individual ranges. Complete copy and export handle the stream as a single set of data.
26. Follow latest output during RUNNING
For a Job still running, the window offers Follow latest output, which automatically follows the recent part of the stream. In the test, the control was enabled and selected while the Job was really RUNNING. When the supervisor recorded it as COMPLETED, GX-TXT disabled Follow and returned its control to the unselected state. On an already terminal Job, Follow must not be presented as an available live stream.

27. Debug Output is not a Program output stream
In the Python Debugger there is also a Debug Output / Console view, associated with the observations and controls of the debug session. It must not be confused with Program output in the Job history: the first panel concerns the work of the debugger, while stdout, stderr and diagnostics belong to the record of the Job. When you need to check a scientific result, refer to the Job and its stored streams, not only to what appears momentarily in the debugger console.
28. Closing the details and returning to the editor
At the end of the inspection close Execution details and the Runner, leaving the management of executions to the supervisor. Closing a window does not delete historical Jobs, their snapshots or logs; the normal High Contrast Dark view of Python Script Workspace remains available. The next guide will cover the difference between a text Dataset derived from stdout and a typed numeric Dataset published explicitly through the GX-TXT APIs.