

GX-TXT Octave Script Workspace: breakpoints, code gutter and folding
The GX-TXT Source editor lets you prepare breakpoints and visually collapse code blocks before starting Debug. The numbered margin (gutter) shows the line markers, the folding symbols and, during a controlled execution, a lane reserved for the current position.
In this guide we work with Octave Script Workspace 1.8.3 of GX-TXT DEV112-P005. All the images show the real GUI in High Contrast Dark mode for the source; only synthetic data are used. Setting breakpoints and folding do not run the script.
1. Preparing an Octave Source with Recognizable Structures
Open Octave Script Workspace, create a script and save it with File → Save in the Session. This example includes a loop, two conditions and a local function, useful for observing the markers on the physical lines:
% Synthetic Octave program for breakpoint and code-fold demonstrations.
% This exercise edits markers but does not start an Octave Job.
samples = [1, 2, 3, 4];
total = 0;
for k = 1:numel(samples)
  if samples(k) > 2
    total = total + samples(k);
  else
    total = total - 1;
  endif
endfor
fprintf('Synthetic total: %d\n', total);

function result = scale_value(value)
  if value >= 0
    result = value * 2;
  else
    result = -value;
  endif
endfunction

disp(scale_value(total));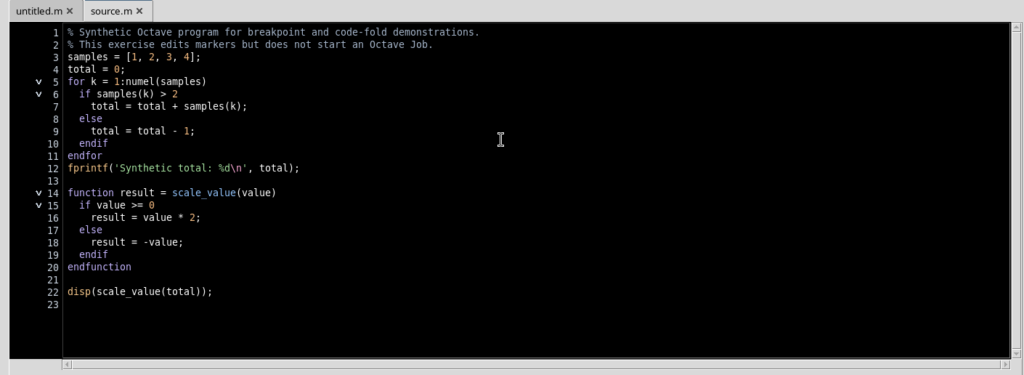
To give the code more room, choose View → Focus source / restore panes. Any additional tool windows can be opened only when needed, keeping the Source readable.
2. Recognizing the Gutter Lanes and Setting a Breakpoint
The margin to the left of the code lines is divided into three zones, each with a distinct function:
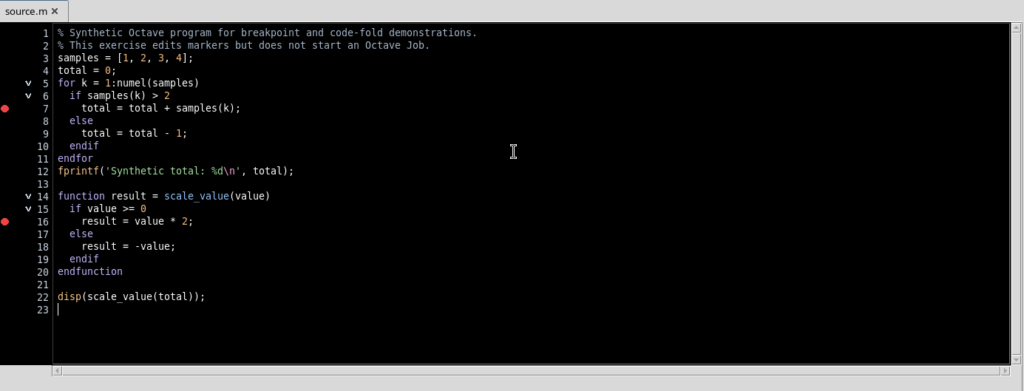
| Gutter lane | Meaning |
|---|---|
| Breakpoint | A filled circle indicates an enabled point; an empty outline indicates a disabled point |
| Execution position | It is reserved for the current-line marker during an actual Debug; it does not coincide with a breakpoint |
| Folding | The small chevron lets you collapse or expand a recognized structure |
Place the cursor on an executable line and press F9. For example, a red circle appears on the line that updates total inside the loop. You can also click the first lane of the gutter next to another executable line.
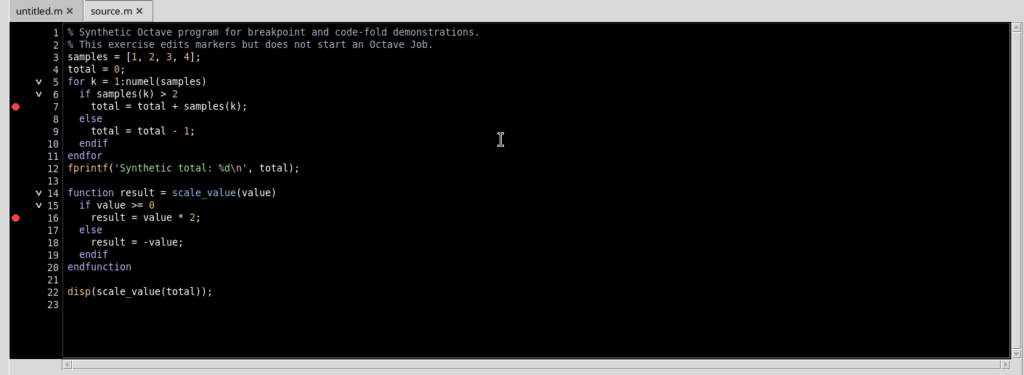
Breakpoints refer to the physical lines of the Source, not to a measurement contained in a Dataset. Inserting them does not change the text of the .m file and does not start any Job.
3. Why Some Lines Do Not Accept Breakpoints
Not all lines are executable positions. With F9, the editor rejects, for example, a comment, an empty line, a function declaration or delimiters such as else, endif and endfunction.
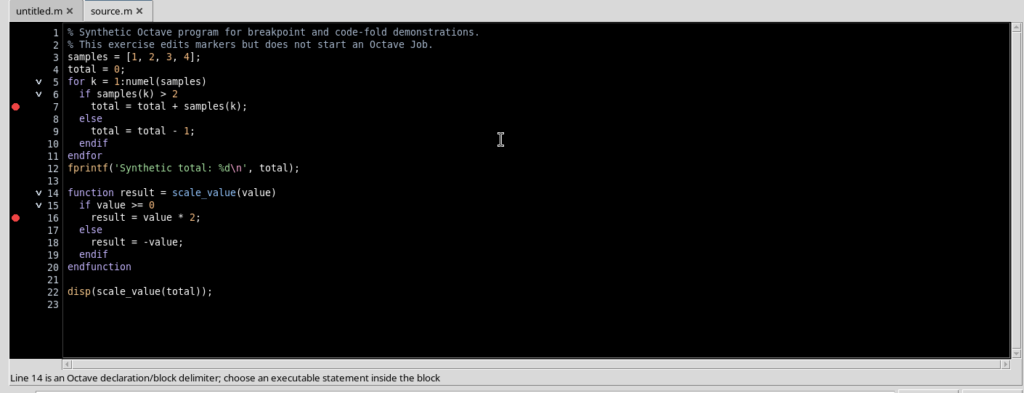
The editor message distinguishes two cases: not an executable statement for comments or empty lines; Octave declaration/block delimiter for some structural headers and closings. Choose a real statement inside the block instead. Breakpoints that are already valid remain unchanged.
When the source model is updated after an edit, you may need to wait until the structure is ready before repeating F9; this avoids setting points on a line layout that is no longer current.
4. Consulting the Breakpoints Tab Without Starting Debug
From the Run → Debug Session script… menu, open the assistant and select the Breakpoints tab, without pressing Start Debug.
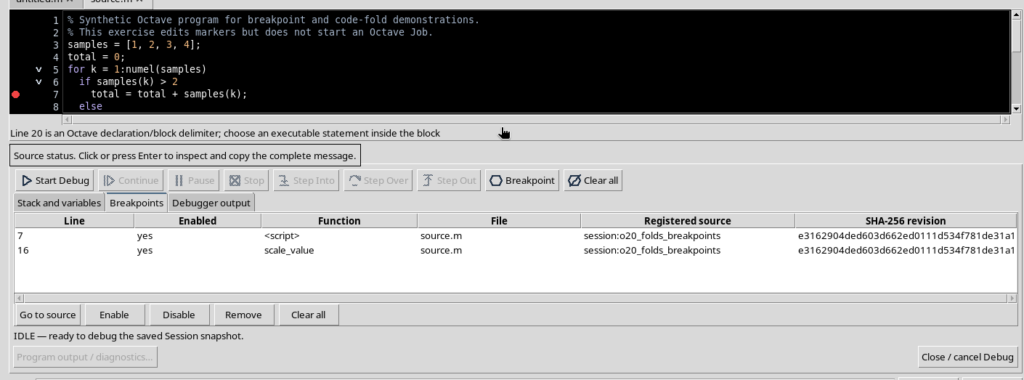
The list lets you check the physical line, the Enabled value (yes/no), the function the point belongs to, the source.m file, the registered script and the revision identified by its SHA-256.
The assistant is still in the IDLE state: opening it to consult the points does not mean starting Octave. The stepping tools and the real execution frames will be covered separately.
5. Disabling, Re-enabling or Removing a Single Point
In the Breakpoints tab, select a row. The buttons Go to source, Enable, Disable, Remove and Clear all let you act on the list without modifying the code.
With Disable, the point remains registered but its indicator in the gutter becomes an empty circle and the table shows Enabled = no. With Enable it becomes active again. Remove deletes only the selected breakpoint.
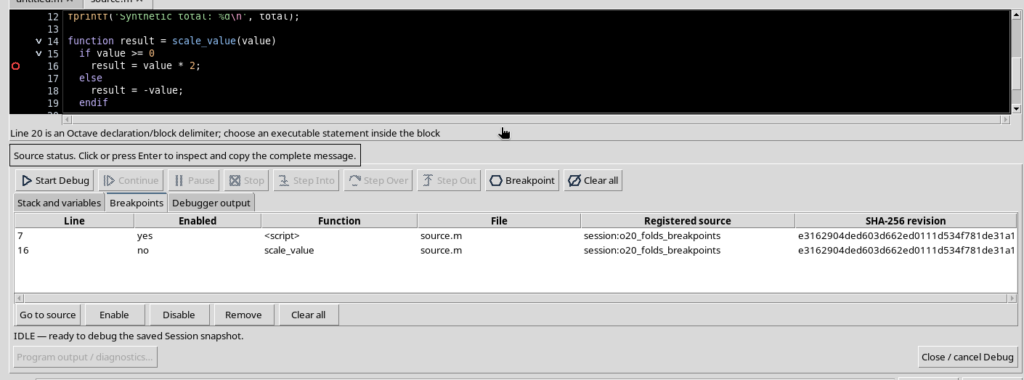
To return to an interface focused on the code, use Close / cancel Debug while the assistant is still inactive. This operation is not the same as cancelling a running Job.
6. Collapsing a Single Block with Fold Current Block
Move the cursor inside a structure, for example into the if of the loop, then choose Edit → Fold current block. The Source recognizes the innermost structural block and hides its body, leaving the header visible.
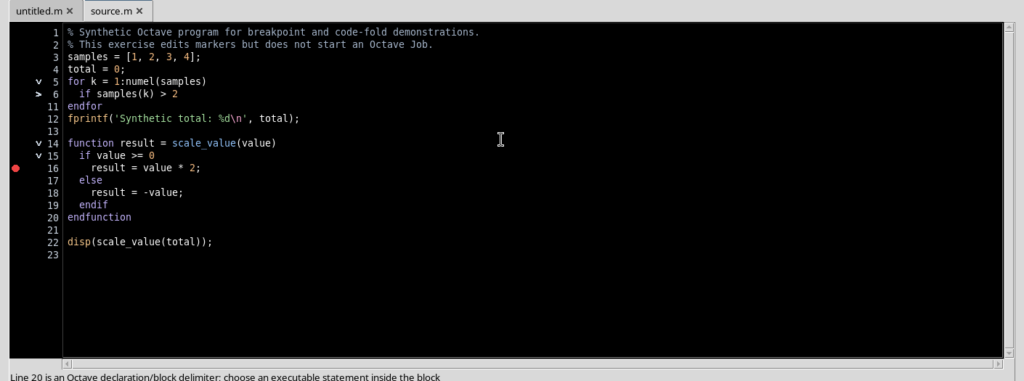
Folding changes only the presentation: it does not delete statements, does not rewrite the source and does not change any breakpoints. The numbering keeps the references to the original lines, even when part of the code is temporarily hidden.
7. Using Fold All, Unfold All and the Side Chevrons
Edit → Fold all collapses the recognized structures, including the nested structures of our example. The main headers of the loop and of the function remain visible.
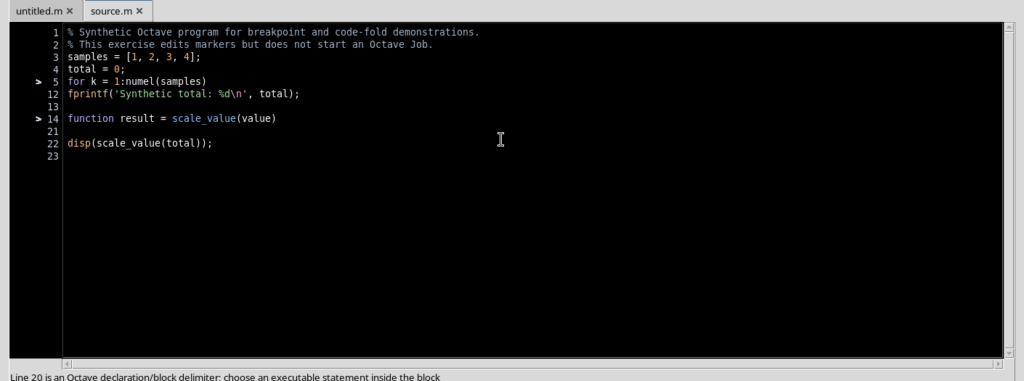
With Edit → Unfold all all the structures become visible again. Alternatively, you can click the small chevron in the third lane of the gutter to open or close a single structure.
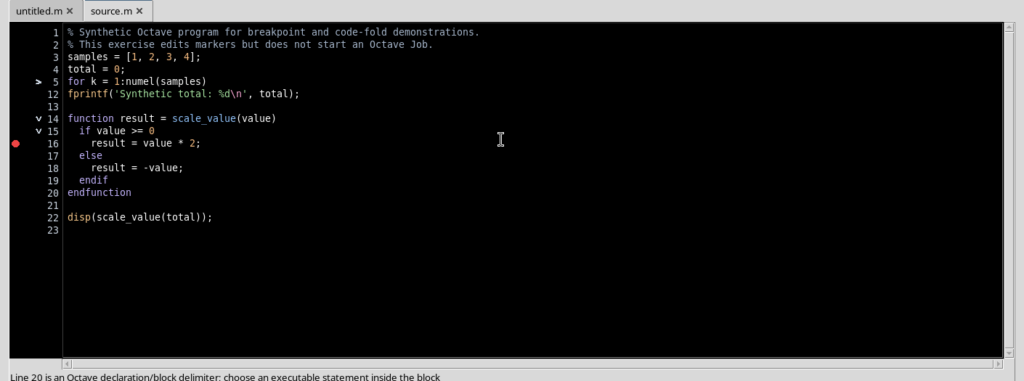
A breakpoint inside a folded block is not deleted: it may be temporarily invisible together with the hidden lines. To check it, reopen the block or consult the Breakpoints tab.
8. Finding Breakpoints Again After Reopening the Viewer
Breakpoints are associated with the registered identity of the script, with the Session and with the source revision, identified by its SHA-256. In this way they are not applied indiscriminately to a different file.
Close Octave Script Workspace with the script saved and reopen the Viewer in the same Session: the points of the corresponding revision are restored.
Persistence concerns the revision markers, not the lifetime of a Job: you are not resuming a suspended execution.
9. Editing the Code Invalidates the Previous Points
If you change the content of the Source, even by adding a simple comment line, GX-TXT clears the breakpoints of the previous layout and reports Source edited; breakpoint positions were cleared. Set them again before Debug.
Until you save, the registered file keeps the previous revision. After File → Save, a new revision with a new SHA-256 is registered; the old points do not reappear automatically, even if the main statements have stayed on the same lines.
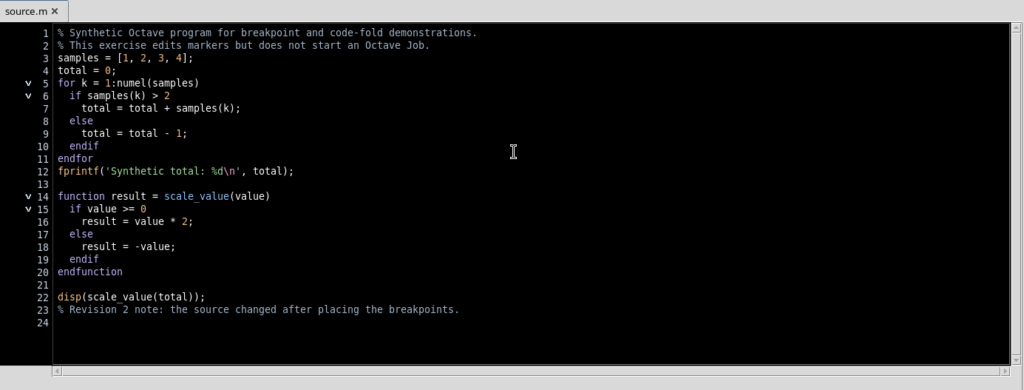
This protection prevents a preserved line number from being mistaken for certainty that the executable statement is still the original one. When you change the code, review the points before running Debug.
10. Setting New Points and Clearing Them with a Shortcut
Once the current revision is saved, use F9 again on an executable statement. The new breakpoint now belongs to the updated revision and does not reactivate those of the previous revision.
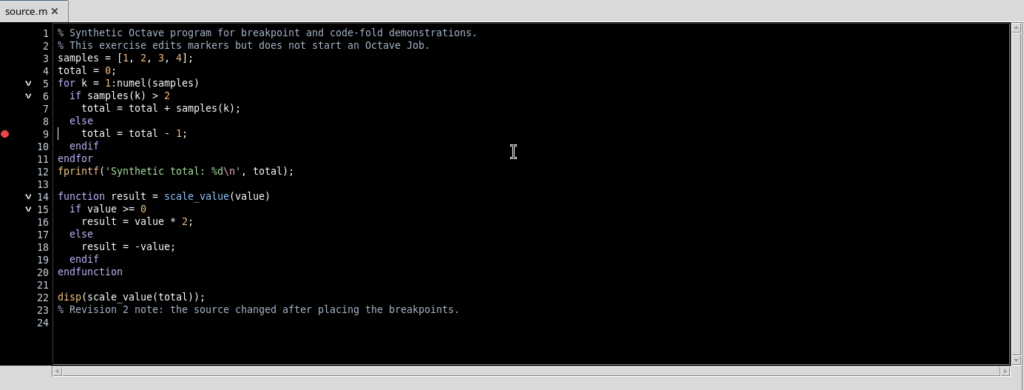
To clear all the breakpoints of the current revision, use Ctrl+Shift+F9, or Clear all in the Breakpoints tab. The table becomes empty, without deleting the Source or the breakpoints historically associated with another saved revision.
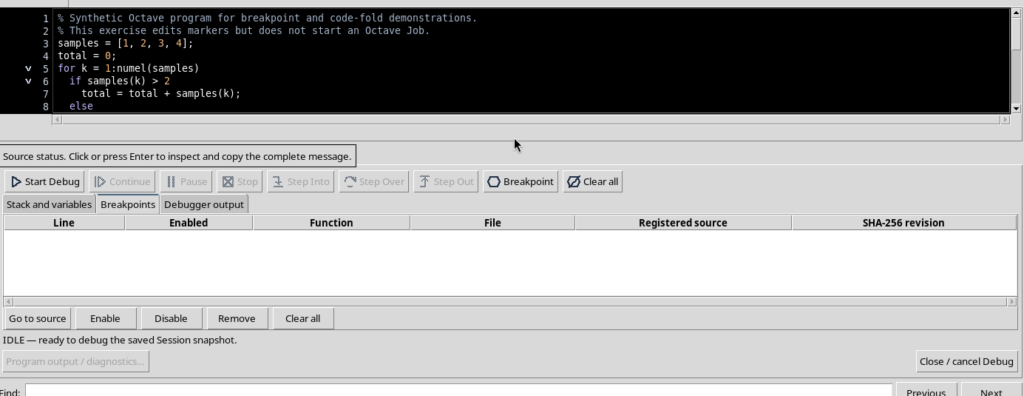
Note on execution markers: the gutter also has a separate lane to indicate the current execution position. This indicator does not appear when Debug is inactive and must not be confused with breakpoints. Actually pausing on a point, starting Start Debug and the Continue, Step Into, Step Over and Step Out commands require a real Debug Job and will be covered in the dedicated guide.
In short, F9 and the gutter prepare breakpoints, Breakpoints manages their state, Fold only collapses the display and Save determines which revision of the code is to be reviewed. None of these operations, on its own, starts the scientific computation.