

Octave Job output: stdout, stderr and diagnostics
A GNU Octave script can produce numerical results, warnings and diagnostic messages. Script Jobs Manager and the Execution details window let you tell them apart and consult them even after the execution has finished. This guide shows the four selectable sources, paged reading, copying and saving the output and the difference between program messages and debugger messages.
The screenshots are taken from the interface of GX-TXT DEV112-P005, with Octave Script Workspace 1.8.3. The source uses the High Contrast Dark theme; the Tk/ttk controls keep their native look. The command names are those visible in the English GUI.
1. Writing a Script That Produces Distinct Output and Warnings
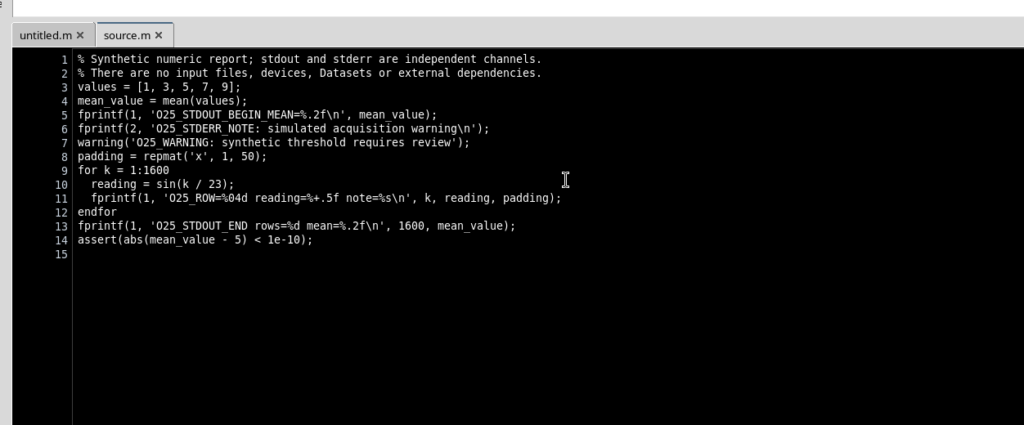
Open Octave Script Workspace in an active Session, choose File → New Script and register the following script with File → Save. The example uses only synthetic data; it does not require instruments, external files or Datasets.
% Synthetic numeric report; stdout and stderr are independent channels.
% There are no input files, devices, Datasets or external dependencies.
values = [1, 3, 5, 7, 9];
mean_value = mean(values);
fprintf(1, 'O25_STDOUT_BEGIN_MEAN=%.2f\n', mean_value);
fprintf(2, 'O25_STDERR_NOTE: simulated acquisition warning\n');
warning('O25_WARNING: synthetic threshold requires review');
padding = repmat('x', 1, 50);
for k = 1:1600
  reading = sin(k / 23);
  fprintf(1, 'O25_ROW=%04d reading=%+.5f note=%s\n', k, reading, padding);
endfor
fprintf(1, 'O25_STDOUT_END rows=%d mean=%.2f\n', 1600, mean_value);
assert(abs(mean_value - 5) < 1e-10);
mean(values) computes the arithmetic mean of the five values, in this case 5. fprintf(1, …) writes to standard output (stdout), while fprintf(2, …) writes to standard error (stderr). warning(…) also generates a GNU Octave warning message. repmat builds a repeated string, useful for obtaining a long log without large data structures; sin generates synthetic numerical readings. The loop creates 1,600 lines, while assert checks the scientific result.
2. Opening the Output of a COMPLETED Job
From the Run → Open Script Runner… menu check the saved revision of the source, choose Validate review and then Run Job. The Job is executed by the supervisor; when it reaches COMPLETED, open Run → Script Jobs Manager…, select its row and choose Jobs → Open execution details.
The details window offers a list of output sources. Selecting Program output shows the lines produced on stdout. In the example they start with:
O25_STDOUT_BEGIN_MEAN=5.00
O25_ROW=0001 reading=+0.04346 note=...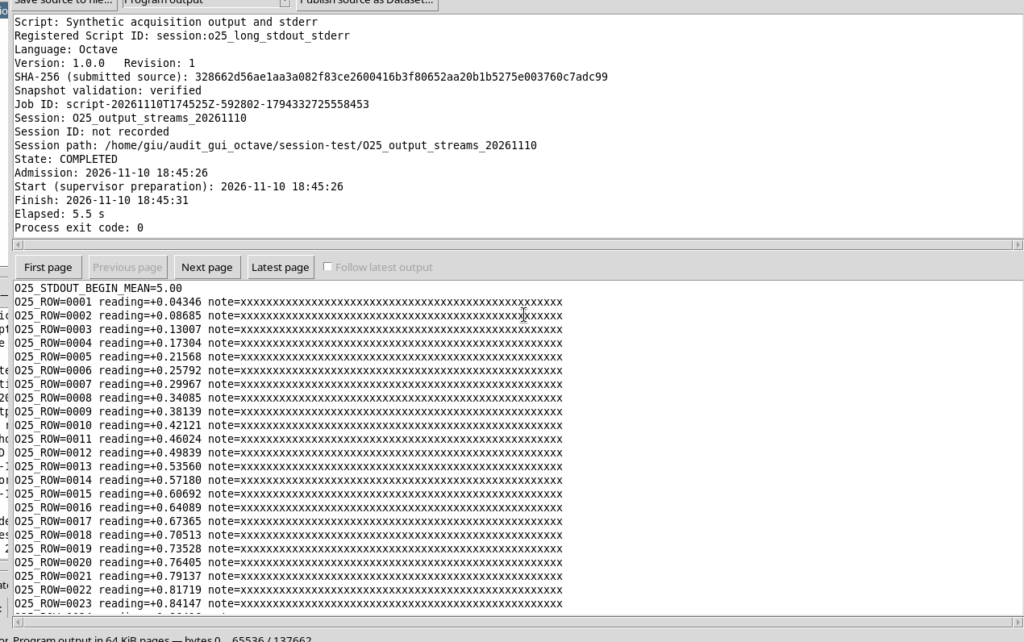
The state of the Job and the revision of the script are information distinct from the content of the stream. Even a COMPLETED Job may have produced warnings on stderr; to read them you need to choose the appropriate source.
3. Reading Long Logs in 64 KiB Pages
The details window offers First page, Previous page, Next page and Latest page. Each page contains up to 64 KiB of the selected stream. When the output is longer, reading the first page does not mean you have read the whole document.
In the example stdout exceeds 137 KB: the first page contains bytes 0 to 65,536, the second 65,536 to 131,072 and the last contains the rest. The final line is:
O25_STDOUT_END rows=1600 mean=5.00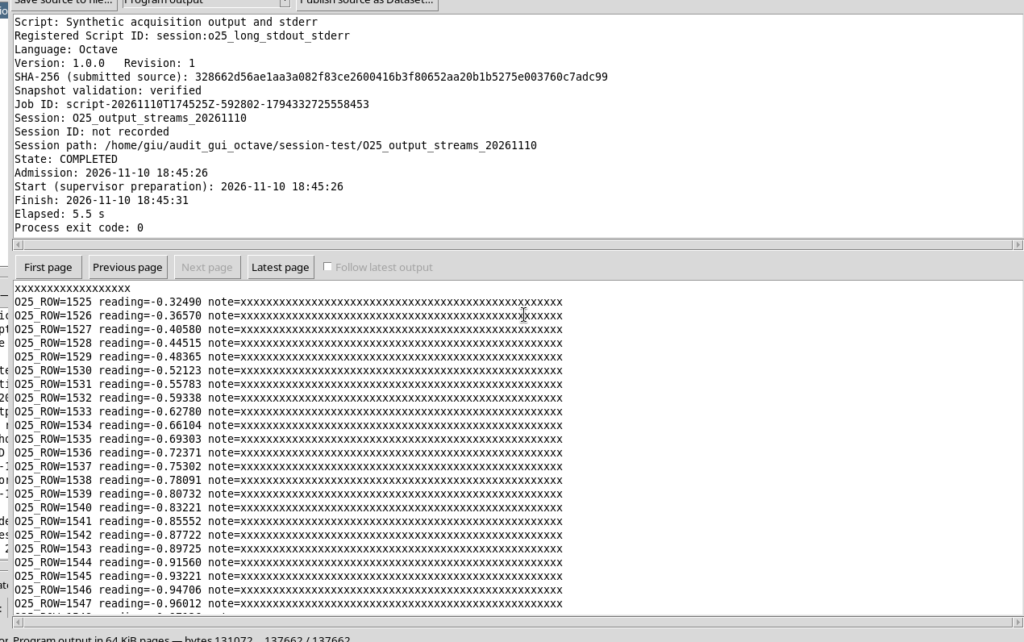
The status line indicates the byte ranges actually shown. Latest page takes you towards the final part of the available content, while Previous page lets you go back. A page can start or end in the middle of a line: sizes are expressed in bytes, not in number of scientific lines.
4. Separating Program stderr from the Numerical Results
Open the list of streams and choose Program stderr. Here you read the message written with fprintf(2, …) and the warning generated by warning(…), including the call trace returned by GNU Octave when available.
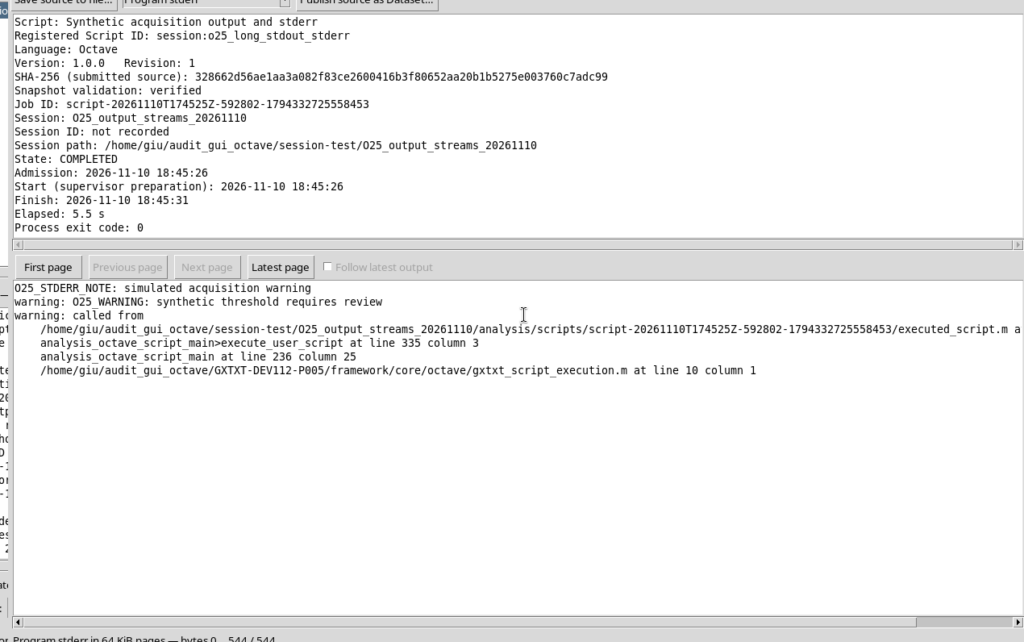
A message on stderr does not automatically imply a FAILED Job. In the first experiment the script generates a warning but ends correctly: the last assert statement detects no errors and the execution is COMPLETED. To decide whether the computation succeeded, consult the state of the Job, not just the presence of text on stderr.
5. Interpreting the Supervisor Diagnostic Log
Select Diagnostic log. This stream concerns the events managed by the Job infrastructure: for example launch and terminal, with identifiers and execution state. It must not be confused with what the script prints as scientific data.
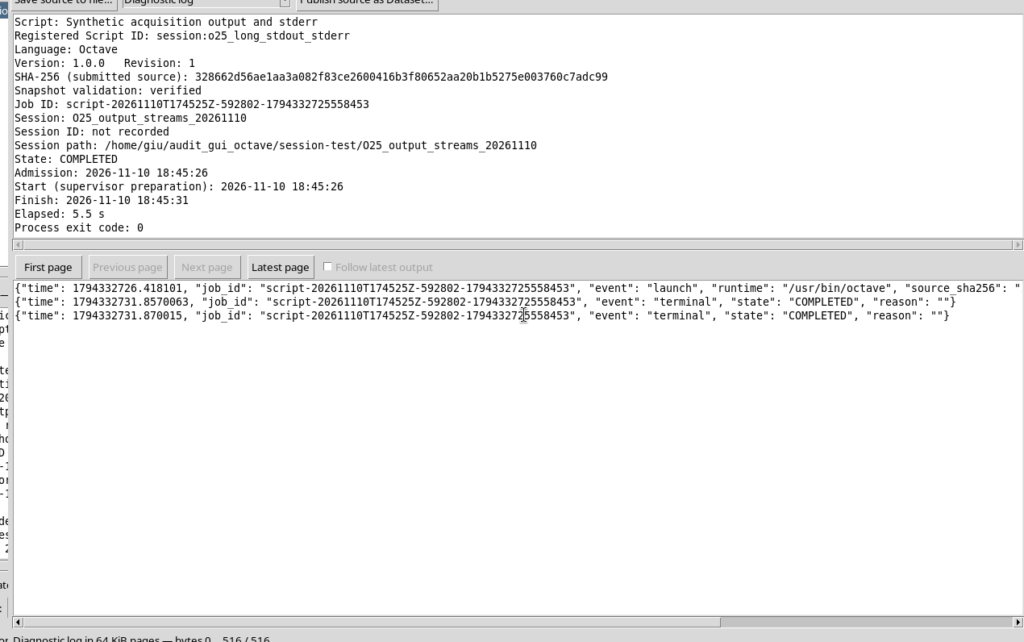
Diagnostic messages come from the supervisor; they can be useful for distinguishing runtime problems, terminal state and user results. Program stderr, instead, remains the natural place for error messages and warnings produced by the interpreter and by the Octave code.
6. Using the Legacy Combined Stream
The selector also includes Legacy combined stream. This view reads the combined stream available for the Job, in which numerical output and warning messages can appear together.
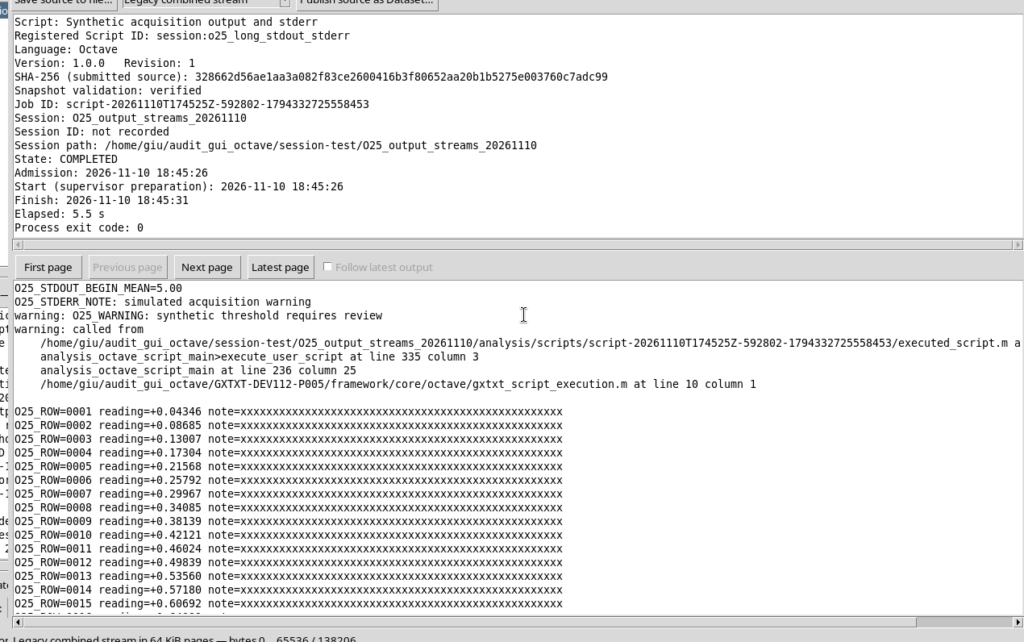
It is useful when you need a quick overview or when consulting an older execution. To correctly attribute the origin of the messages, however, it is better to use Program output, Program stderr and Diagnostic log separately, when available. The combined view does not replace a scientific classification of the messages.
7. Copying the Visible Page or the Entire Stream
In the details window, Select visible page selects the text of the displayed page and Copy selection copies it to the clipboard. With the first page of the example you therefore copy 65,536 characters, not the whole output.
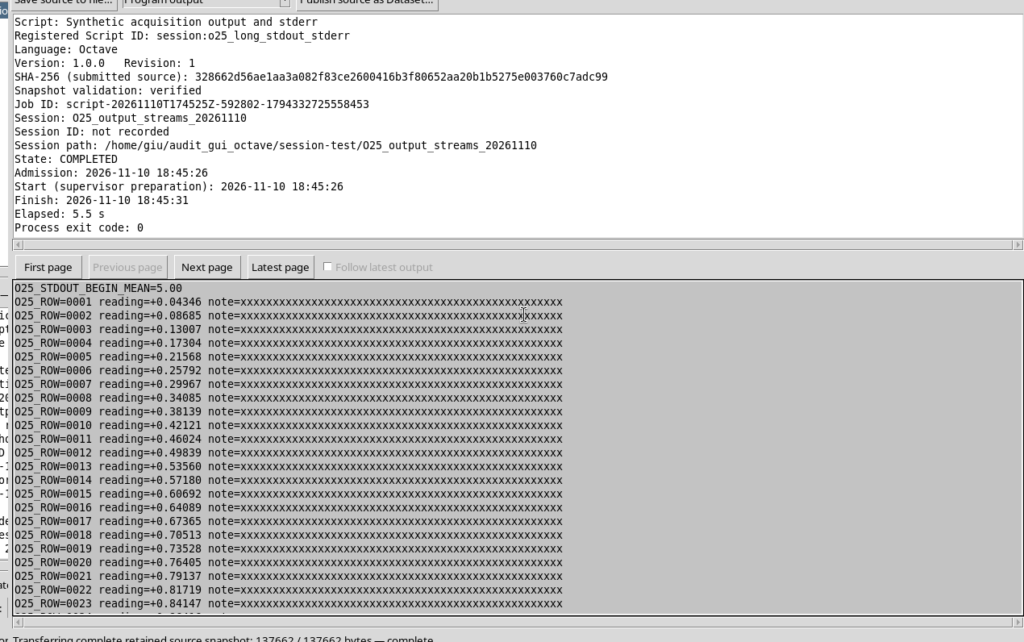
To copy the entire content select Copy entire source instead. Here the word source means the stream chosen in the selector, not the .m source code file. For our stdout the full copy includes all 137,662 bytes, including the final line, instead of stopping after the first page.
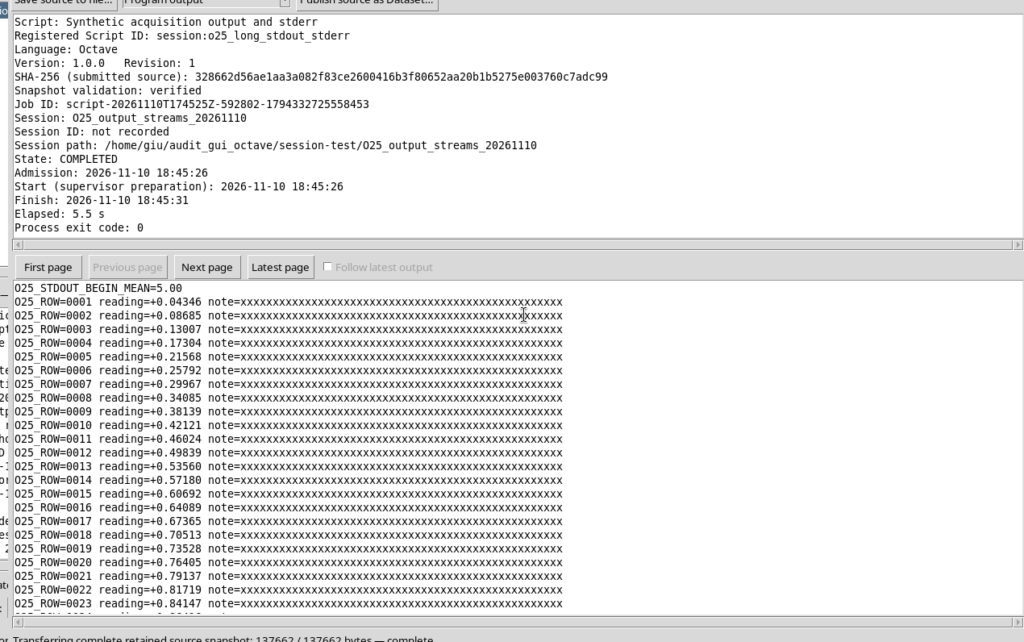
For a long text, choose the command according to the purpose: Copy selection for an identified portion, Copy entire source when you need to retrieve the whole stored log.
8. Saving the Full Output Through the System Dialog
Save source to file… opens the native file selector. After indicating the destination and choosing Save, GX-TXT transfers the whole selected stream, not just the current page.
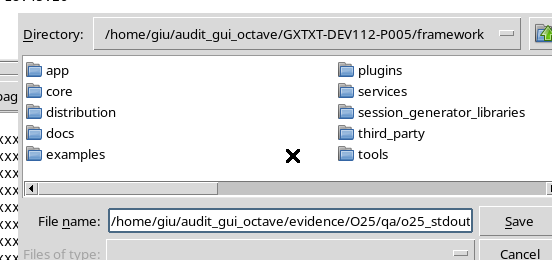
It is advisable to give the file a name that identifies Job, stream type and execution date. The operation exports a copy of the output: it does not modify the original Job or its revision. The destination must be outside the originating scientific Session, to keep user-generated files separate from managed snapshots.
9. Comparing stdout, stderr and Diagnostics When the Job Fails
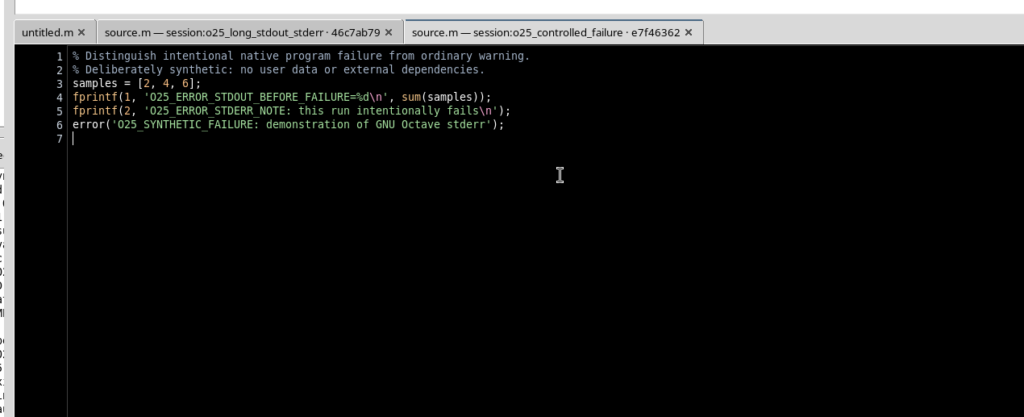
Another example shows an intentional Octave error:
% Distinguish intentional native program failure from ordinary warning.
% Deliberately synthetic: no user data or external dependencies.
samples = [2, 4, 6];
fprintf(1, 'O25_ERROR_STDOUT_BEFORE_FAILURE=%d\n', sum(samples));
fprintf(2, 'O25_ERROR_STDERR_NOTE: this run intentionally fails\n');
error('O25_SYNTHETIC_FAILURE: demonstration of GNU Octave stderr');
This program first writes a numerical value to stdout, then a note to stderr and finally generates an error with error(…). In the Job Manager the state becomes FAILED. Selecting Program stderr, you read the GNU Octave error and the position in the source:
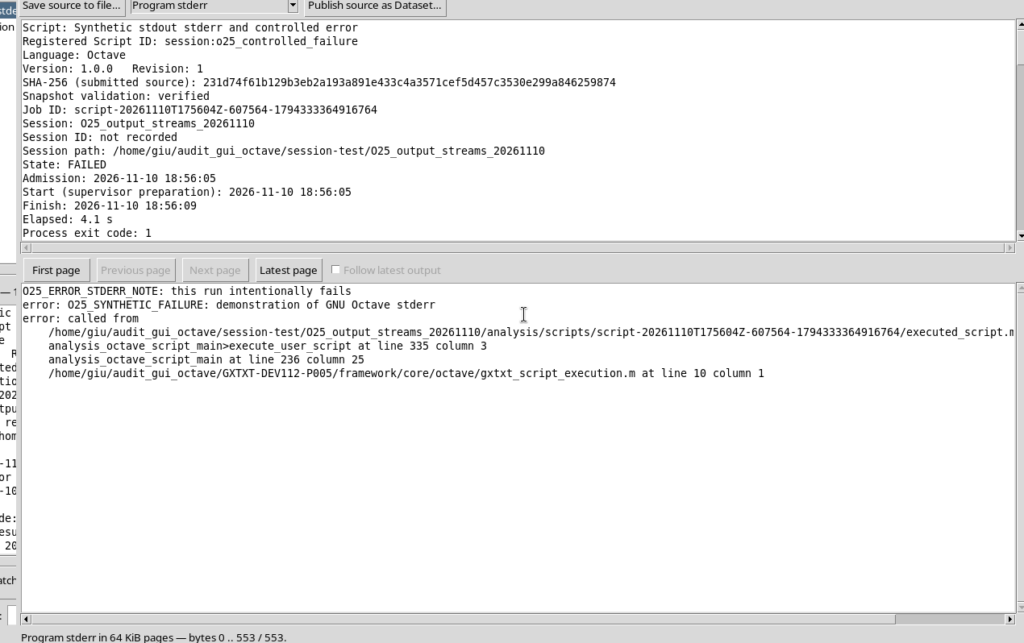
Program output still keeps the message written before the error: O25_ERROR_STDOUT_BEFORE_FAILURE=12. The Diagnostic log, instead, reports the supervisor events and the terminal state FAILED.
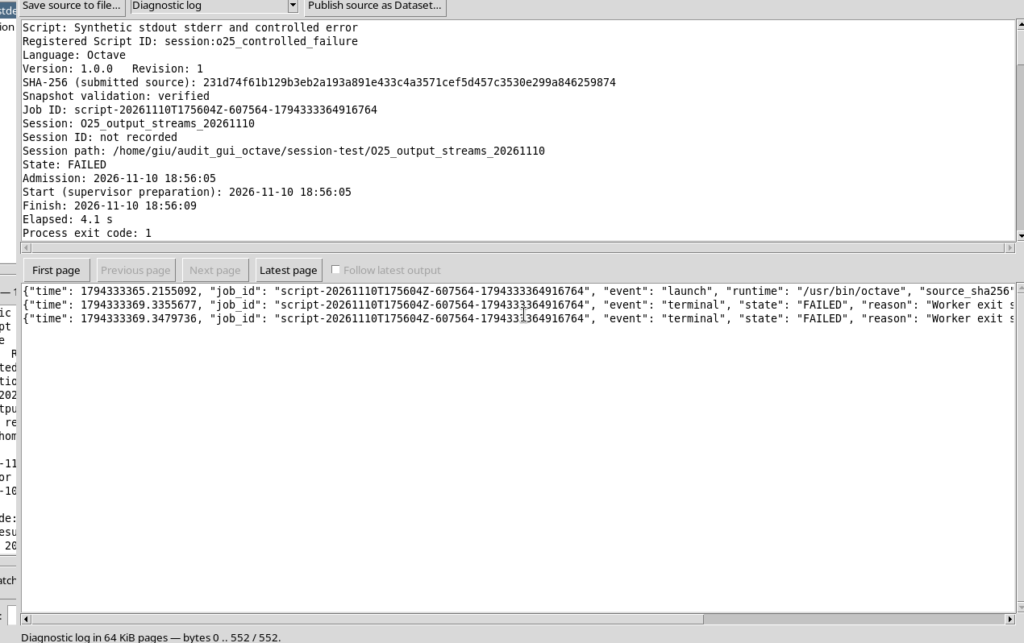
This comparison shows why it is not advisable to use a single stream as the only source of diagnosis: the partial result, the cause of the error and the execution state are complementary information.
10. Distinguishing Debugger Output from Program Output
The Debugger output pane is located in the debugger opened from Run → Debug Session script…. It does not coincide with any of the four streams selectable in Execution details: it contains messages related to the debugger commands and states.
For example, with a numerical script that calls a function:
% Synthetic native GNU Octave debugger stdout and Debugger output.
1; % Enable local functions in an executable script.
function result = double_value(number)
  result = number * 2;
endfunction
sample = 7;
value = double_value(sample);
fprintf(1, 'O25_DEBUG_RESULT=%d\n', value);
assert(value == 14);
Setting a breakpoint on the value = double_value(sample) call and starting Start Debug, the pane reports PAUSED. After Continue it also shows the COMPLETED conclusion.
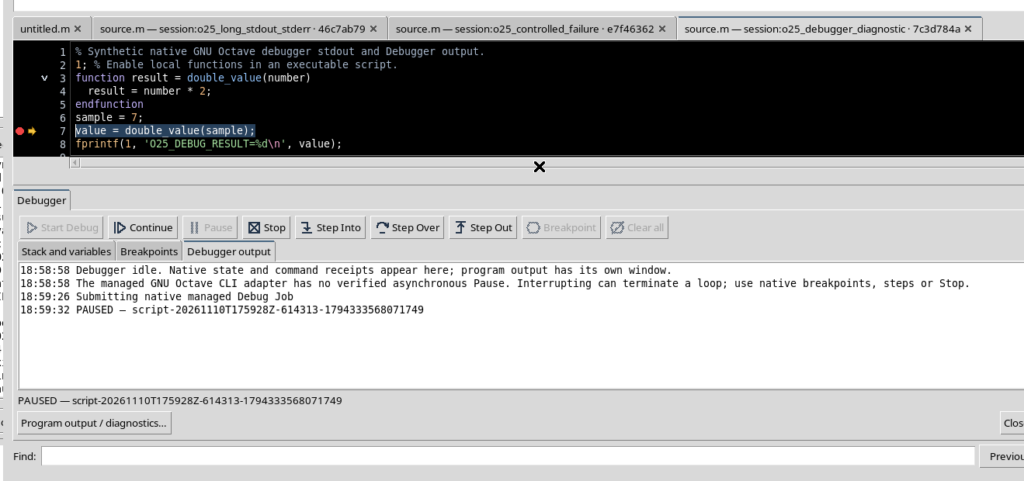
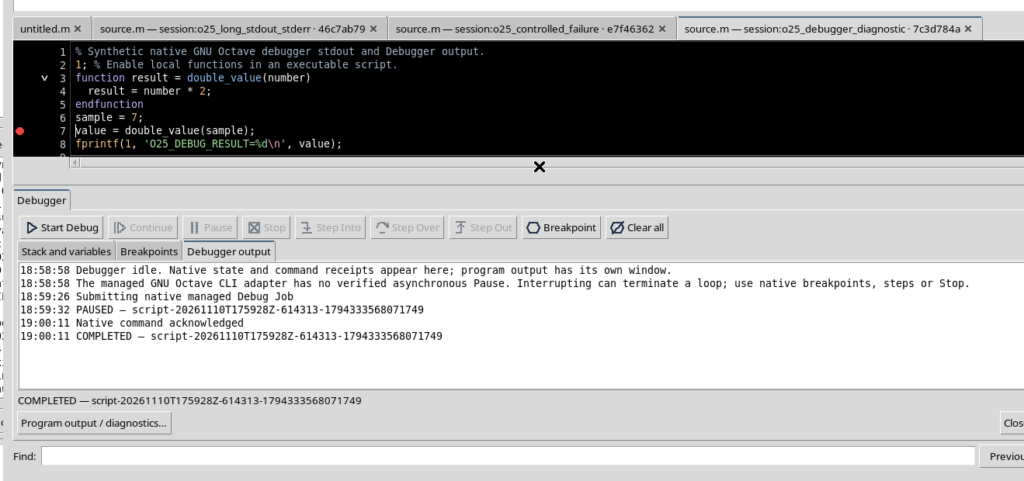
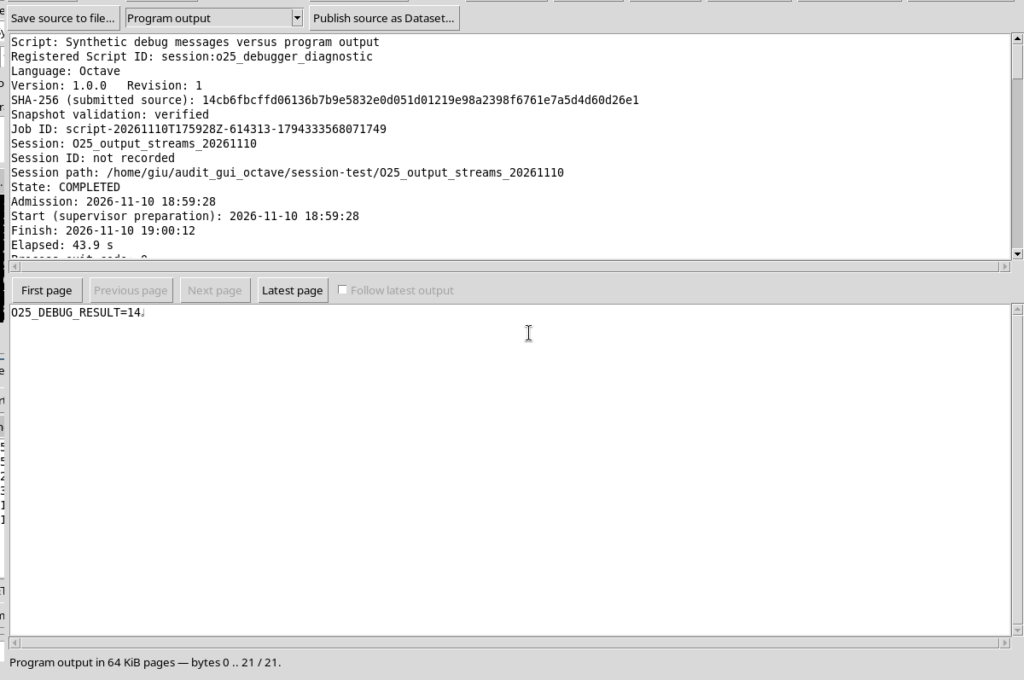
The scientific value O25_DEBUG_RESULT=14 is not a debugger message: it appears in Program output, reachable through Program output / diagnostics….
11. Follow Latest Output During Execution
For a Job that is still active, the details window can enable Follow latest output. The function is meant to follow the most recent part of the stream while the script produces new data. It can be useful for a processing run that records samples progressively.
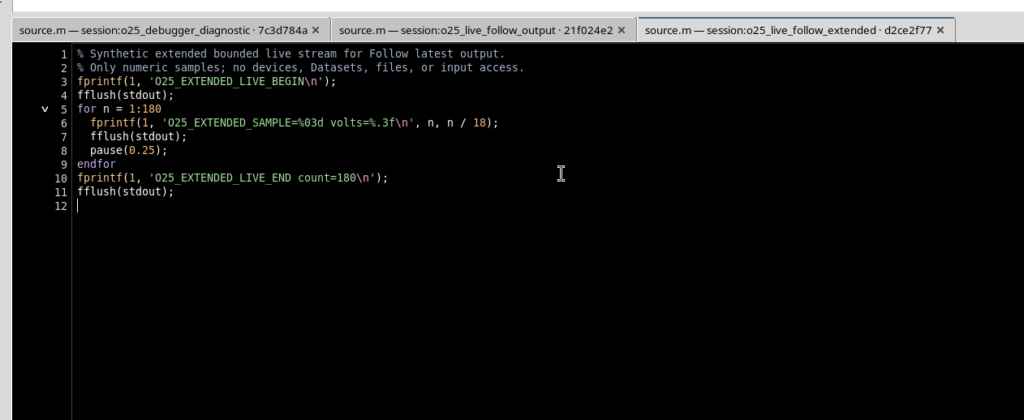
The following example produces a finite stream of readings, with deliberate pauses. fflush(stdout) requests that the output data be written, while pause sets the time between samples:
% Synthetic extended bounded live stream for Follow latest output.
% Only numeric samples; no devices, Datasets, files, or input access.
fprintf(1, 'O25_EXTENDED_LIVE_BEGIN\n');
fflush(stdout);
for n = 1:180
  fprintf(1, 'O25_EXTENDED_SAMPLE=%03d volts=%.3f\n', n, n / 18);
  fflush(stdout);
  pause(0.25);
endfor
fprintf(1, 'O25_EXTENDED_LIVE_END count=180\n');
fflush(stdout);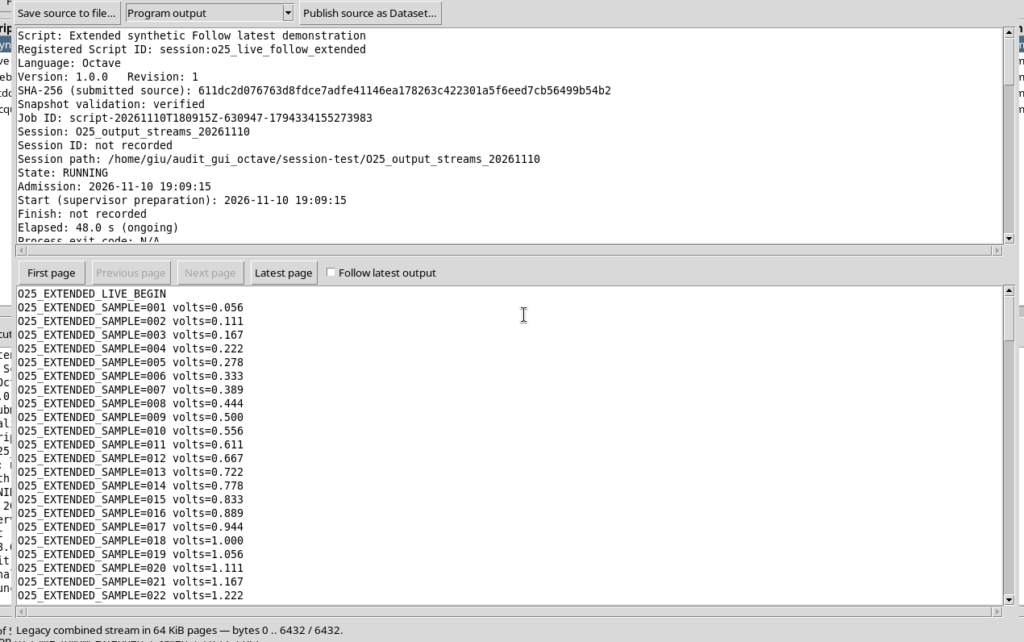
The availability of the control depends on the state of the Job. After COMPLETED the option is disabled, but all the pages of the output already stored remain available.
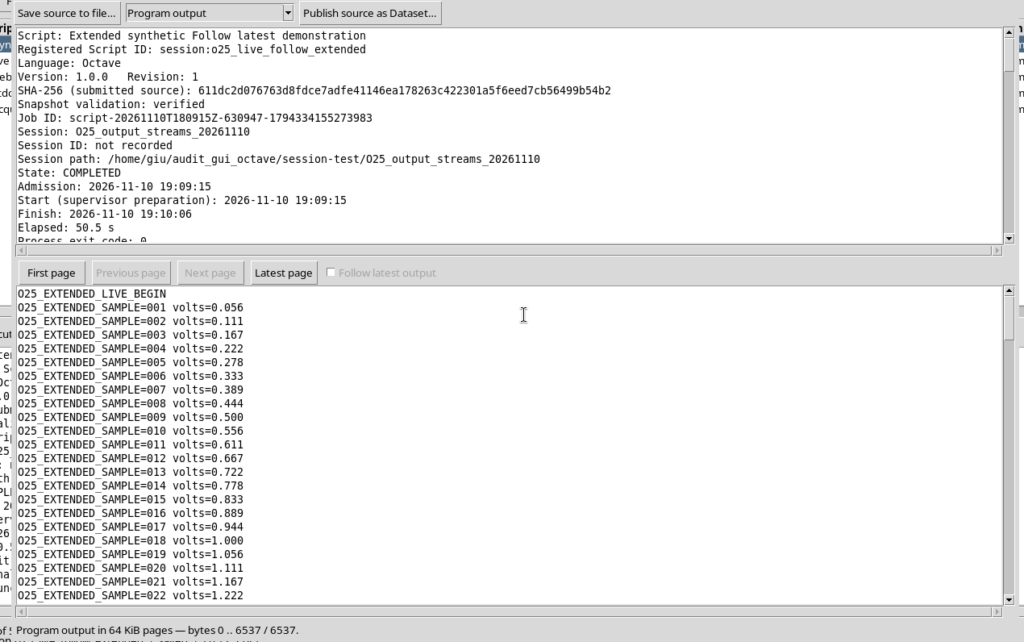
If the window was opened when the output was still empty, Reconnect lets you read the updated page again. Latest page can also be used to see the most recent bytes available. Do not interpret a temporarily empty box as proof that the Job has produced no data: check the state and refresh the view.
12. Closing the Details Without Losing the History
To return to the editor, close the details windows, then the Script Jobs Manager. Completed and failed executions remain available in their history; closing the windows does not automatically delete the Jobs and is not equivalent to Cancel Job.
In conclusion, the streams must be interpreted according to their function: stdout documents what the program produces, stderr reports warnings and errors from the interpreter, Diagnostic log describes supervisor events, Legacy combined stream keeps a combined view and Debugger output documents the debugger actions. To reconstruct a scientific execution, use the Job state, the source revision and the appropriate streams together.